
Understanding the Nasdaq Rally: Insights from MarketVibe Metrics
The recent Nasdaq rally, fueled by optimism surrounding potential peace talks with Iran, highlights the complex interplay of market sentiment, geopolitical events, and underlying market mechanics. In this article, we'll explore how MarketVibe's metrics can help traders understand and navigate such market dynamics, focusing on key indicators like the Crash Warning Index (CWI), % Above 50-DMA, and ATR%. By the end, you'll have a clearer picture of how these tools can inform your trading process.
Orientation: Why MarketVibe Metrics Matter
Crash Warning Index (CWI)
The Crash Warning Index (CWI) is a composite measure that aggregates several risk dimensions, including market breadth, volatility, and defensive behavior. Traders should care about the CWI because it provides an early warning signal for potential market corrections. By understanding the CWI, traders can make informed decisions about risk management and portfolio adjustments, reducing blind spots related to sudden market shifts.
% Above 50-DMA
The % Above 50-DMA measures the percentage of stocks trading above their 50-day moving average. This breadth indicator helps traders assess the overall health of market trends. A high percentage suggests strong market momentum, while a low percentage indicates potential weakness or oversold conditions.
ATR%
ATR% (Average True Range as a percentage of price) gauges market volatility. It helps traders understand whether the market is in a quiet trending phase or experiencing choppy, unstable conditions. Knowing the volatility regime can guide traders in adjusting their strategies accordingly.
How These Metrics Work
Crash Warning Index (CWI) Mechanics
The CWI is constructed by combining various indicators that reflect market risk, such as breadth measures, volatility indices, and defensive sector performance. For example, a high CWI reading might result from deteriorating breadth, rising volatility, and increased defensive sector activity. The CWI moves based on changes in these underlying components, offering a dynamic view of market risk.
% Above 50-DMA Mechanics
This metric evaluates a universe of stocks, typically within a major index like the Nasdaq, to determine how many are trading above their 50-day moving averages. The calculation is straightforward: divide the number of stocks above their 50-DMA by the total number of stocks in the index, then multiply by 100 to get a percentage. Daily movements in this metric are influenced by individual stock performances relative to their moving averages.
ATR% Mechanics
ATR% is calculated by taking the average true range of an index or stock over a specified period and expressing it as a percentage of the current price. This provides a normalized measure of volatility, allowing traders to compare volatility across different time frames and market conditions.
Interpretation: What Different Levels Mean
Crash Warning Index (CWI)
- Below 3: Generally indicates a low-risk environment, conducive to risk-taking.
- Between 3 and 6: Suggests moderate risk; traders should be cautious but not overly defensive.
- Above 6: Signals elevated risk; corrections are more likely, and defensive strategies are advisable.
% Above 50-DMA
- Above 70%: Indicates strong market momentum and a healthy trend.
- Between 40% and 70%: Reflects a mixed market, requiring careful stock selection.
- Below 40%: Suggests market weakness or oversold conditions, often preceding a rebound or further decline.
ATR%
- Low ATR%: Typically corresponds to stable, trending markets.
- High ATR%: Indicates increased volatility, often seen during market corrections or periods of uncertainty.
Real-World Scenarios
Scenario 1: A Topping Market
Imagine a scenario where the Nasdaq index continues to rise, but the % Above 50-DMA starts to decline. This divergence may indicate that fewer stocks are participating in the rally, a potential warning sign of a market top. Traders might feel tempted to chase the rally, but a more informed approach would be to monitor the CWI for rising risk and consider reducing exposure.
Scenario 2: A New Bull Leg
In a strong new bull market, the % Above 50-DMA might surge above 70% and remain elevated. This suggests broad participation and robust momentum. Traders should look for opportunities to add exposure, provided their setups align with the broader trend.
Scenario 3: Volatility Spike
During geopolitical tensions, such as the recent Iran peace talks, ATR% might spike, reflecting increased market volatility. The CWI could also rise, indicating heightened risk. In such cases, traders should consider hedging strategies or reducing position sizes to manage risk effectively.
How to Use This Insight in a Process
- When breadth is weak and CWI is high, emphasize defense and reduce new risk. This might involve tightening stop-losses or shifting to more defensive sectors.
- When breadth and leadership broaden out, be open to adding exposure, but only if your setups are there. Use the Market Dashboard to confirm the broader market regime.
- Use Market Dashboard as a high-level regime label, then check internals like % Above 50-DMA and ATR% for confirmation.
Common Misuses & Misconceptions
Treating metrics as stand-alone entry signals: Metrics like CWI and % Above 50-DMA should guide risk posture, not dictate precise entry points.
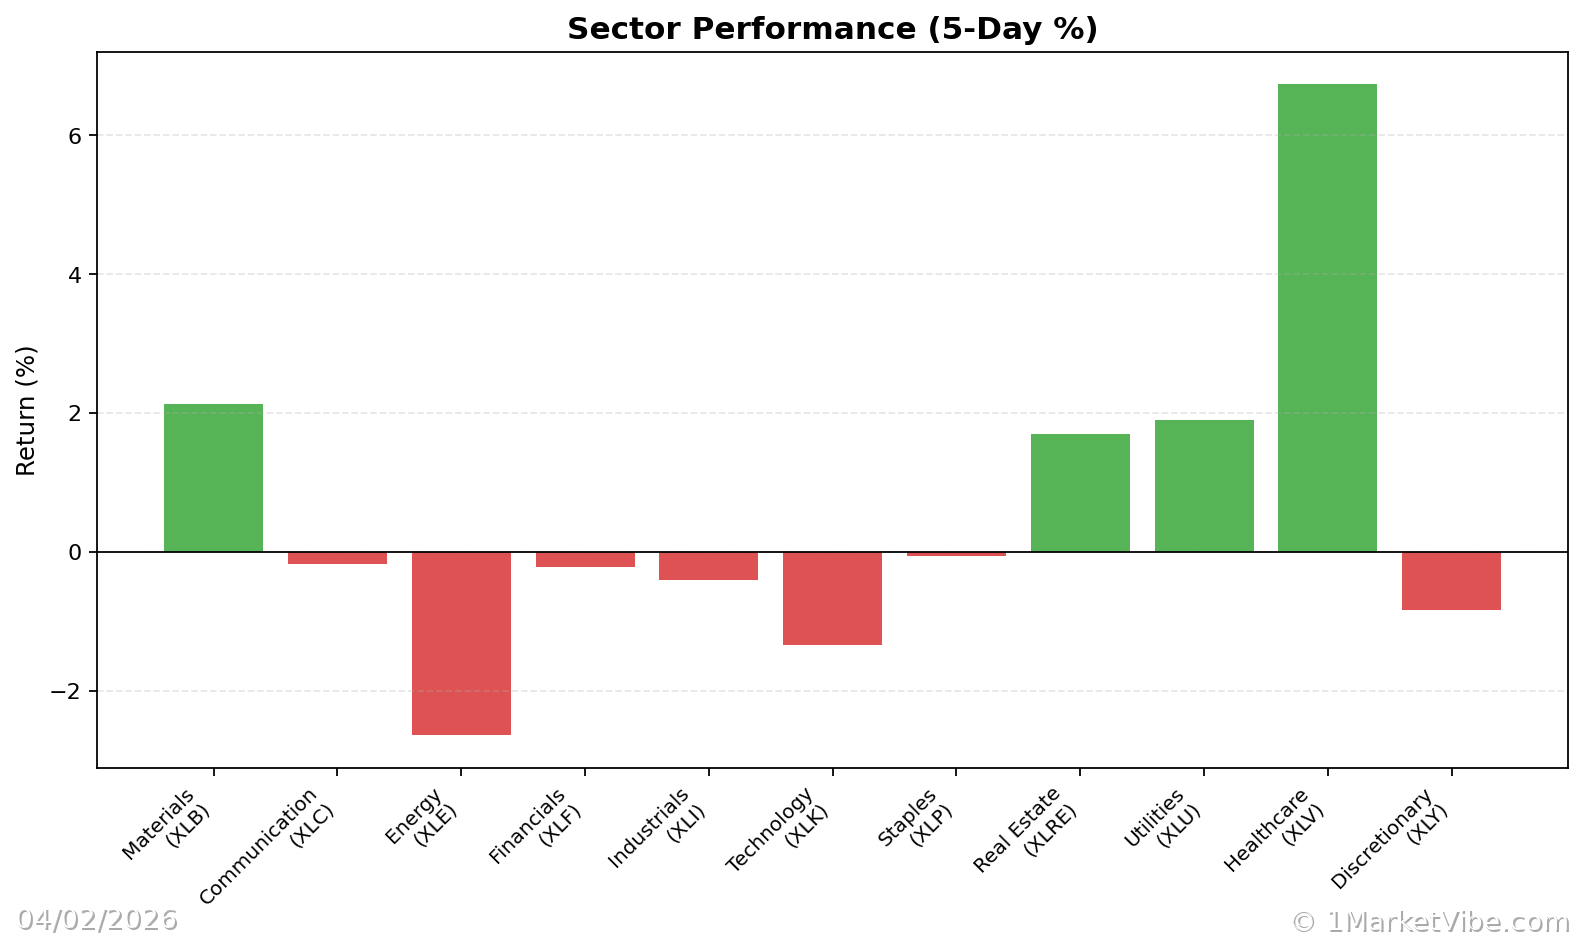
Ignoring context: Always consider sector rotation and broader market conditions when interpreting these metrics.
Overreacting to one-day changes: Look for sustained trends or patterns rather than reacting to daily fluctuations.
To see these breadth and risk metrics in one place each day, you can use the Decision Edge dashboard at 1marketvibe.com.
Disclaimer: The information provided in this article is for educational purposes only and should not be considered as financial advice. Always conduct your own research and consult with a financial advisor before making investment decisions.