
Introduction
In recent weeks, oil prices have surged significantly amid escalating tensions between Iran and other global powers. This geopolitical standoff has not only affected the energy markets but also sent ripples across global financial markets. Understanding how these developments impact market dynamics is crucial for traders and investors. In this article, we'll explore how MarketVibe's metrics, such as the Crash Warning Index (CWI) and the Decision Edge Dashboard, can help traders navigate this complex environment.
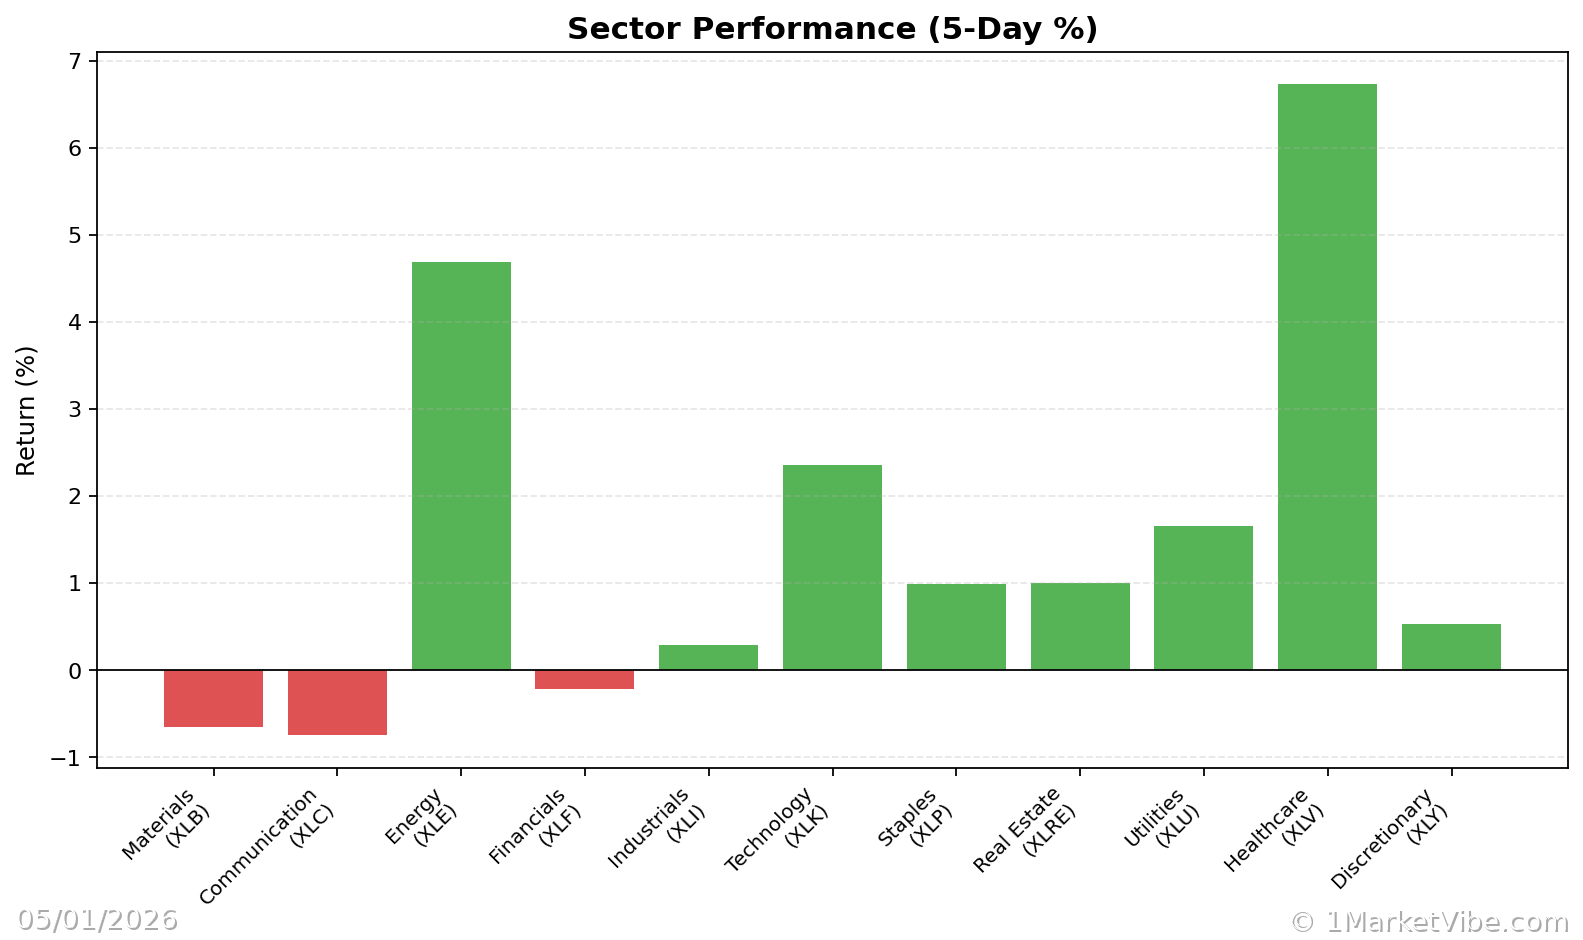
Current Oil Price Trends
Oil prices have experienced a sharp increase due to the ongoing standoff with Iran. This rise is driven by fears of supply disruptions in the Middle East, a critical region for global oil production. As a result, energy stocks have also seen heightened volatility, reflecting the broader market's uncertainty about future supply and demand dynamics.
Iran Standoff Overview
The geopolitical tensions with Iran have heightened concerns about potential military conflicts, sanctions, and disruptions in oil supply chains. These factors contribute to increased volatility in the oil markets, which can have broader implications for global financial stability.
Market Reactions
Crash Warning Index (CWI)
The Crash Warning Index (CWI) is a composite metric that assesses market risk by analyzing several dimensions, including breadth, volatility, and defensive behavior. Currently, the CWI stands at 4.4, indicating a moderate level of risk. This suggests that while the market is not in immediate danger of a crash, traders should remain vigilant.
- Why Traders Should Care: The CWI helps traders understand the underlying risk in the market. It informs decisions about position sizing and risk management, reducing blind spots related to sudden market shifts.
Market Dashboard
The Market Dashboard provides a high-level view of market conditions, categorizing them into various states such as "Stable," "Caution," or "At Risk." This dashboard helps traders quickly assess the market's overall health and adjust their strategies accordingly.
- Why Traders Should Care: By using the Market Dashboard, traders can align their risk posture with the current market regime, ensuring they are neither too aggressive nor too conservative.
Impact on Energy Stocks
The surge in oil prices has led to increased volatility in energy stocks. Traders should pay attention to the Average True Range Percentage (ATR%), which measures volatility relative to price. A high ATR% indicates a volatile market, while a low ATR% suggests a more stable environment.
- Example Scenario: If ATR% for energy stocks rises significantly, it may signal increased risk and the need for tighter risk management strategies.
Global Market Implications
The impact of rising oil prices extends beyond the energy sector. Higher oil prices can lead to increased production costs, affecting various industries and potentially leading to inflationary pressures. This broader market impact underscores the importance of monitoring market breadth indicators, such as the % Above 50-DMA, which measures the percentage of stocks trading above their 50-day moving average.
- Interpretation: When the % Above 50-DMA is low, it indicates weak market breadth, suggesting that fewer stocks are participating in the rally, which could be a warning sign of a potential market correction.
Historical Context
Historically, geopolitical tensions in the Middle East have led to spikes in oil prices and increased market volatility. By analyzing past events, traders can better understand potential market reactions and prepare for similar scenarios.
Expert Opinions
Market experts suggest that while the current situation is tense, it is essential to focus on data-driven insights rather than speculation. Utilizing tools like the CWI and Market Dashboard can provide a more structured approach to navigating these uncertain times.
Conclusion
The ongoing Iran standoff and resulting surge in oil prices highlight the importance of understanding market dynamics and using data-driven insights to inform trading decisions. By leveraging MarketVibe's metrics, traders can better navigate the complexities of the current market environment.
To see these breadth and risk metrics in one place each day, you can use the Decision Edge dashboard at 1marketvibe.com.
Disclaimer: This article is for informational purposes only and should not be considered financial advice. Always conduct your own research before making investment decisions.