
Market Stability Amidst Faltering Iran Peace Talks and Rising Oil Prices
- Authors

- Name
- MarketVibe Team
- @1marketvibe
Market Stability Amidst Faltering Iran Peace Talks and Rising Oil Prices
In the current market environment, geopolitical tensions, particularly those involving Iran, have a significant influence on market stability and investor sentiment. As peace talks between the U.S. and Iran stall, oil prices are on the rise, creating a complex backdrop for market participants. Understanding how these factors interact with market stability is crucial for informed decision-making. In this article, we'll explore how MarketVibe's metrics can provide insights into market stability during such geopolitical events.
Orientation – What Are We Explaining?
The main concept we'll explore is market stability in the context of geopolitical tensions and rising oil prices. Traders should care about this because geopolitical events can lead to increased market volatility and affect sector performance, particularly in energy-related stocks. By understanding how market stability is measured and what influences it, traders can make better-informed decisions about risk management and portfolio adjustments.
Market stability is not a single metric but rather a combination of several indicators that provide a comprehensive view of market conditions. These include the Crash Warning Index (CWI), % Above 50-DMA, ATR%, and sector performance metrics. Each of these plays a role in assessing the current market regime and potential risks.
How It Works – Mechanics & Data
Crash Warning Index (CWI)
The CWI is a composite index that evaluates market risk by considering various factors such as breadth, volatility, and defensive behavior. It aggregates data from multiple sources to provide a single risk score. A higher CWI indicates elevated market risk, suggesting that corrections are more likely.
% Above 50-DMA
The % Above 50-DMA measures the percentage of stocks trading above their 50-day moving average. It serves as a breadth indicator, reflecting the overall health of market trends. A high percentage suggests strong market breadth, while a low percentage indicates weakness.
ATR%
ATR% measures volatility relative to price, providing insight into market stability. Low ATR% values are associated with stable, trending markets, whereas high ATR% values indicate increased volatility and potential instability.
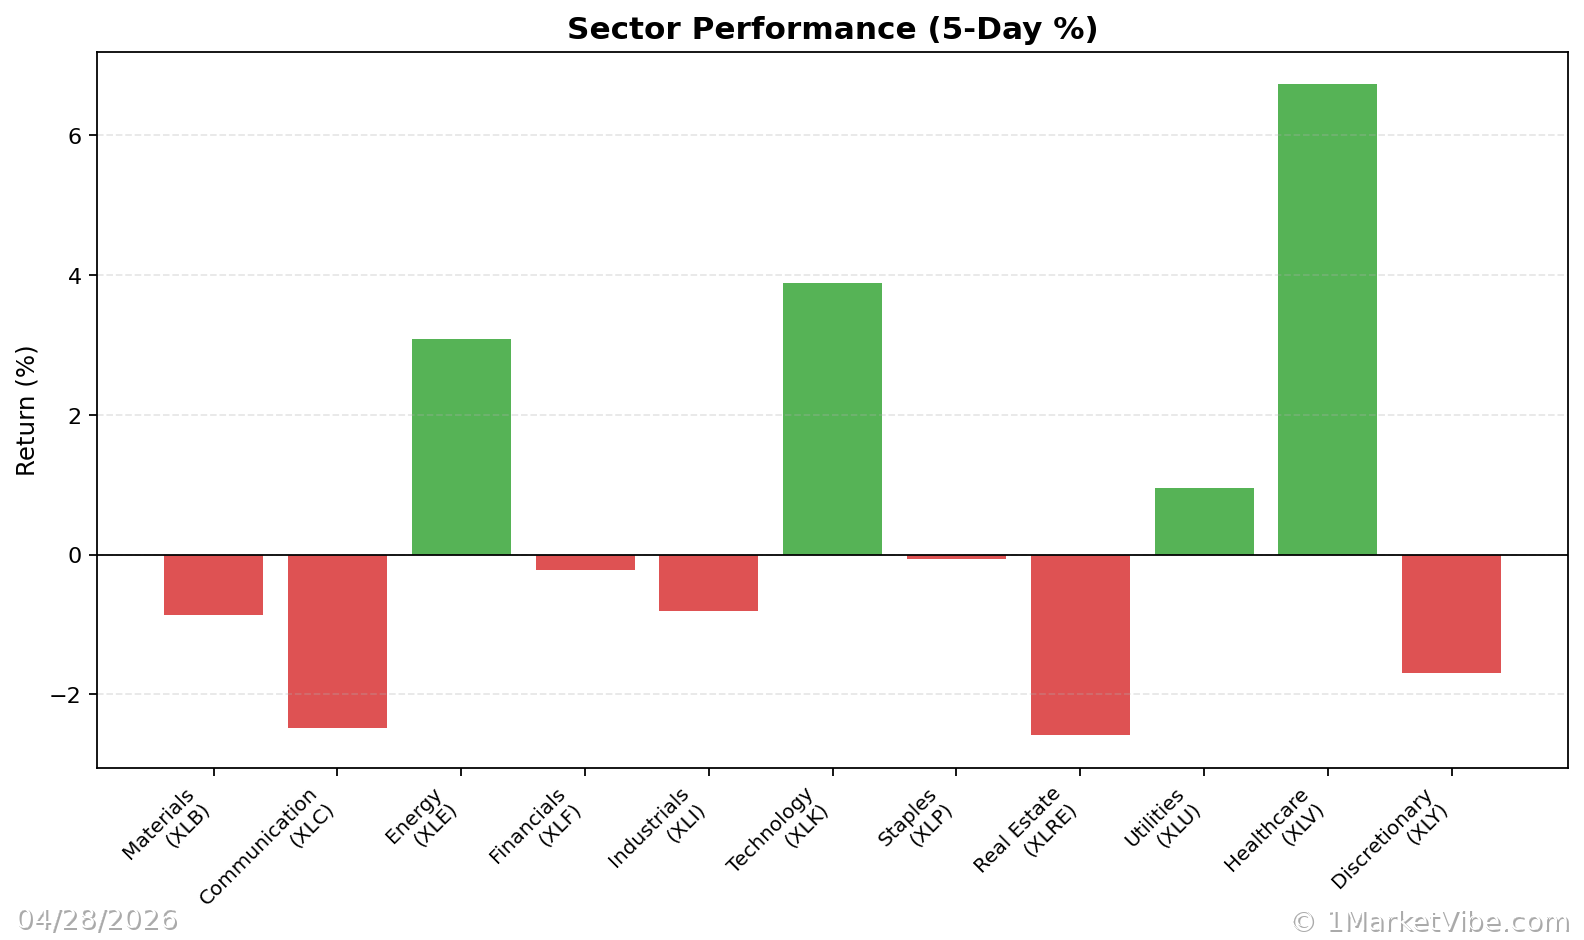
Sector Scores
Sector scores provide insights into leadership and rotation within the market. By analyzing which sectors are leading or lagging, traders can identify shifts in market dynamics and potential opportunities or risks.
Interpretation – What Different Levels Tend to Mean
CWI Levels
- CWI below 3: Generally indicates a stable market environment with lower risk.
- CWI around 6: Suggests elevated risk, with potential for market corrections.
- CWI above 6: High risk, often associated with significant market volatility and potential downturns.
% Above 50-DMA
- Above 70%: Indicates strong market breadth and a healthy uptrend.
- Below 30%: Suggests weak breadth, often seen in oversold or bearish conditions.
ATR% Levels
- Low ATR% (less than 1%): Corresponds to quiet, stable market phases.
- High ATR% (greater than 2%): Indicates choppy or unstable market conditions.
Common Combinations
- Strong breadth + low volatility: Typically seen in robust bull markets.
- Weak breadth + rising volatility: Often precedes market corrections or downturns.
- Defensive sectors leading: May indicate a cautious market environment, especially when CWI is high.
Real-World Scenarios – How This Shows Up in Markets
Scenario 1: Topping Environment
Imagine a scenario where major indices are reaching new highs, but the % Above 50-DMA is declining. This suggests that fewer stocks are participating in the rally, a potential warning sign. In such cases, the CWI might start rising, indicating increased risk. Traders might feel tempted to chase the highs, but a more informed approach would involve tightening risk controls and monitoring for signs of a reversal.
Scenario 2: Bull Leg with Strong Breadth
In a strong bull market leg, the % Above 50-DMA might surge above 70% and remain elevated. This indicates widespread participation in the rally, supported by low ATR% values, suggesting stability. Traders can consider adding exposure, provided their setups align with the broader trend.
Scenario 3: Volatility Spike
During geopolitical tensions, such as the current Iran situation, ATR% might spike, reflecting increased volatility. If the CWI also rises, it signals heightened risk. Traders might be tempted to react impulsively, but a disciplined approach would involve reassessing risk exposure and considering hedging strategies.
How to Use This Insight in a Process
- Emphasize Defense: When breadth is weak and CWI is high, focus on defensive strategies and reduce new risk exposure.
- Broaden Exposure: When breadth and leadership are strong, be open to increasing exposure, but only if your setups support it.
- Use Market Dashboard: Leverage the Market Dashboard for a high-level view of market regimes, then confirm with internal metrics like CWI and % Above 50-DMA.
Common Misuses & Misconceptions
- Stand-Alone Signals: Avoid treating any single metric as a standalone entry signal. Always consider the broader context.
- Ignoring Context: Don't overlook sector rotation and time frame. Metrics should be part of a comprehensive analysis.
- Overreacting to One-Day Changes: Metrics can fluctuate daily; focus on trends and sustained changes for more reliable insights.
To see these breadth and risk metrics in one place each day, you can use the Decision Edge dashboard at 1marketvibe.com.
DISCLAIMER: This article is for informational purposes only and does not constitute financial advice. Market conditions can change rapidly, and past performance is not indicative of future results. Always conduct your own research and consult with a financial advisor before making investment decisions.