

Implications of the Fed's Rate Hike for Your Investment Strategy
- Authors

- Name
- MarketVibe Team
- @1marketvibe
Implications of the Fed's Rate Hike for Your Investment Strategy
The Federal Reserve's recent indication of a potential rate hike has stirred the financial markets, prompting investors to reassess their strategies. Understanding the implications of such monetary policy changes is crucial for informed decision-making. In this article, we'll explore how MarketVibe's metrics can help traders navigate the evolving landscape and adjust their investment strategies accordingly.
Understanding the Fed's Rate Hike and Its Importance
A rate hike by the Federal Reserve typically signals an effort to control inflation and stabilize the economy. For traders, this can mean shifts in market sentiment, affecting everything from stock prices to sector performance. It's essential to grasp how these changes might influence your portfolio and what MarketVibe's tools can reveal about the underlying market dynamics.
Why Traders Should Care
- Decision-Making: Knowing how interest rates impact different sectors can guide allocation decisions.
- Risk Management: Understanding market breadth and volatility helps in assessing risk levels.
- Process Integration: Incorporating these insights into a structured process can enhance long-term performance.
How MarketVibe Metrics Work
MarketVibe offers several key metrics that provide a comprehensive view of market conditions:
Crash Warning Index (CWI)
The CWI is a composite metric that aggregates various risk dimensions, including market breadth, volatility, and defensive behavior. It helps traders gauge the likelihood of market corrections. A CWI reading above 6 suggests elevated risk, while a reading around 3 indicates moderate risk.
% Above 50-DMA
This metric measures the percentage of stocks trading above their 50-day moving average, offering insight into market breadth and trend health. A high percentage indicates strong market breadth, while a low percentage suggests weakness or an oversold condition.
ATR%
The ATR% measures volatility relative to price, providing context on market stability. Low ATR% values often correspond to trending phases, whereas high ATR% values indicate choppy or unstable conditions.
Interpreting MarketVibe Metrics
Ranges and Regimes
- CWI: Above 6 indicates high risk; around 3 suggests moderate risk.
- % Above 50-DMA: Below 40% often signals a weak market; above 70% suggests strength.
- ATR%: Low values indicate stability; high values suggest volatility.
Common Combinations
- Strong Breadth + Low Volatility: Indicative of a stable, trending market.
- Weak Breadth + Rising Volatility: Signals potential market instability.
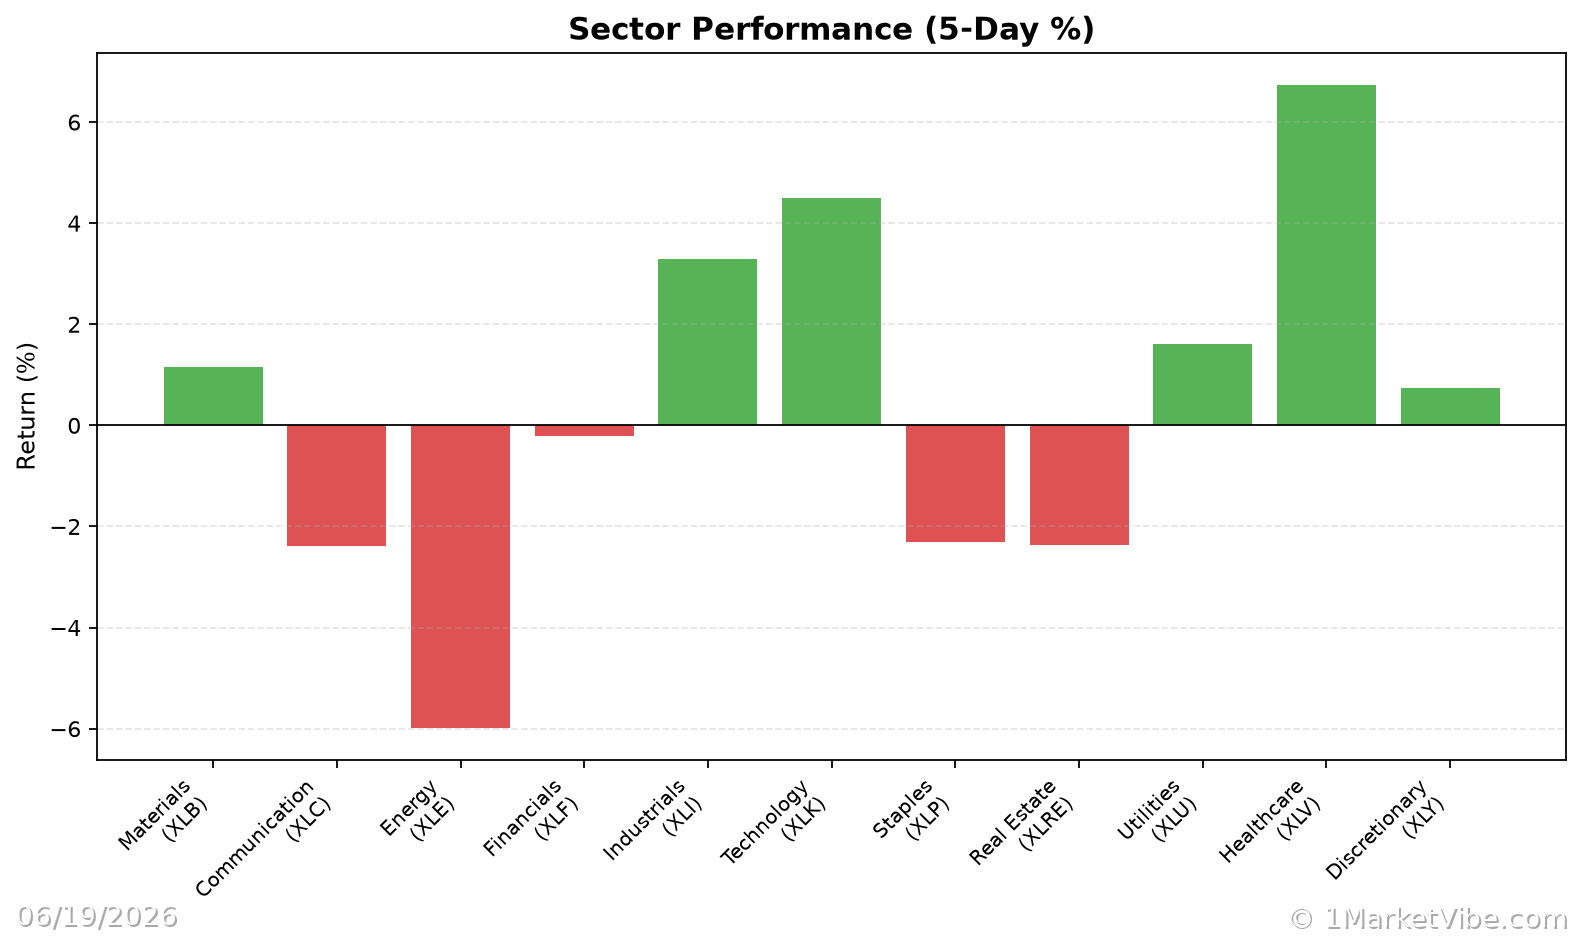
- Defensive Sector Leadership: Often seen in high-risk environments.
Real-World Scenarios
Scenario 1: Topping Environment
Imagine a scenario where the index grinds higher, but the % Above 50-DMA declines. This divergence often precedes a market top. Traders might feel tempted to chase the rally, but a more informed approach would be to reduce exposure and prepare for potential corrections.
Scenario 2: Bull Market Leg
In a strong bull market, the % Above 50-DMA surges and remains elevated, indicating robust market breadth. Traders might be inclined to increase exposure, but it's crucial to ensure setups align with broader market conditions.
Scenario 3: Volatility Spike
A sudden increase in ATR% alongside a rising CWI suggests heightened market volatility. Traders may feel the urge to react impulsively, but a disciplined approach would involve reassessing risk and considering hedging strategies.
Incorporating Insights into Your Process
Practical Guidelines
- High CWI and Weak Breadth: Emphasize defensive strategies and limit new risk.
- Broadening Breadth and Leadership: Consider adding exposure if setups align.
- Use Market Dashboard: Leverage it as a high-level regime label and confirm with internals.
Common Misuses and Misconceptions
- Stand-Alone Signals: Avoid treating metrics as entry signals; use them to guide risk posture.
- Ignoring Context: Consider sector rotation and time frames for a holistic view.
- Overreacting to Daily Changes: Focus on trends and broader patterns rather than day-to-day fluctuations.
To see these breadth and risk metrics in one place each day, you can use the Decision Edge dashboard at 1marketvibe.com.
DISCLAIMER: This article is for informational purposes only and should not be considered financial advice. Always conduct your own research or consult a financial advisor before making investment decisions.