

Fed's Hawkish Policy Creates Market Uncertainty for Investors
- Authors

- Name
- MarketVibe Team
- @1marketvibe
Fed's Hawkish Policy Creates Market Uncertainty for Investors
In recent times, the Federal Reserve's hawkish stance has become a focal point for investors, creating waves of uncertainty across the financial markets. Understanding how this policy shift impacts market dynamics is crucial for traders aiming to navigate these turbulent waters effectively. In this article, we will explore the implications of the Fed's hawkish policy, using MarketVibe's metrics to provide a structured view of the current market environment.
Current Market Sentiment
The recent Federal Reserve meeting, led by new Chairman Kevin Warsh, has left interest rates unchanged but signaled potential rate hikes in the near future. This announcement has led to mixed reactions from investors, with stock futures showing positive movement while overall market sentiment remains neutral. Such a scenario underscores the importance of understanding the underlying market mechanics and how they are influenced by Fed policies.
Fed's Hawkish Shift
The Fed's hawkish shift refers to its inclination towards tightening monetary policy, typically through raising interest rates. This approach is often adopted to combat inflation but can lead to increased borrowing costs and reduced consumer spending. For traders, this shift can signal a potential change in market conditions, requiring adjustments in risk management strategies.
Impact on Rate Hike Expectations
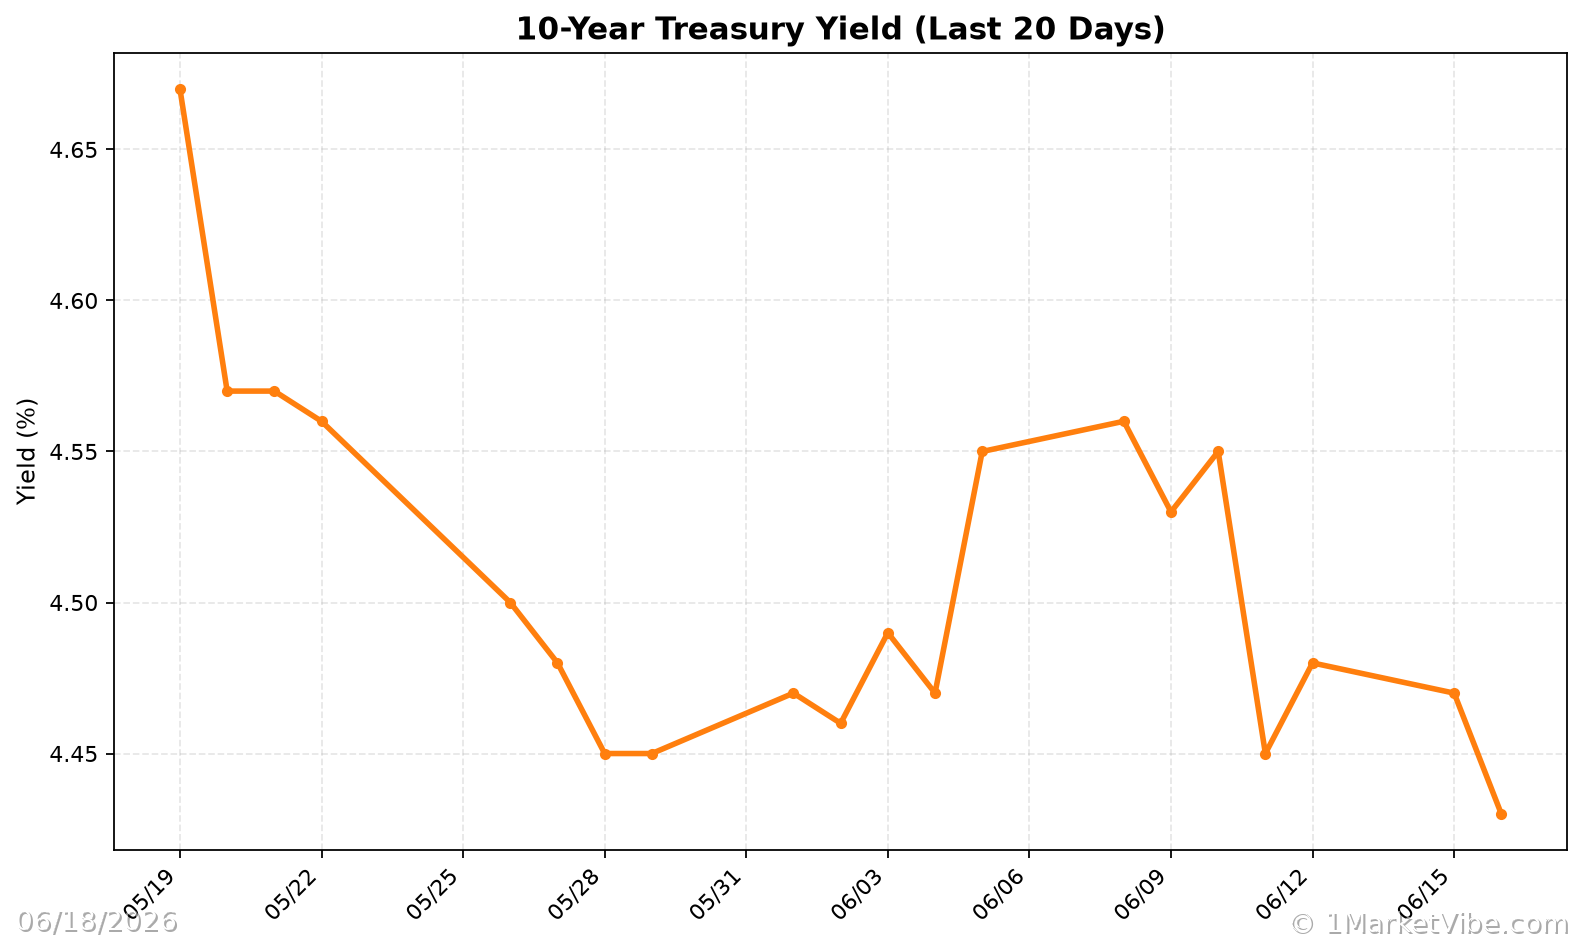
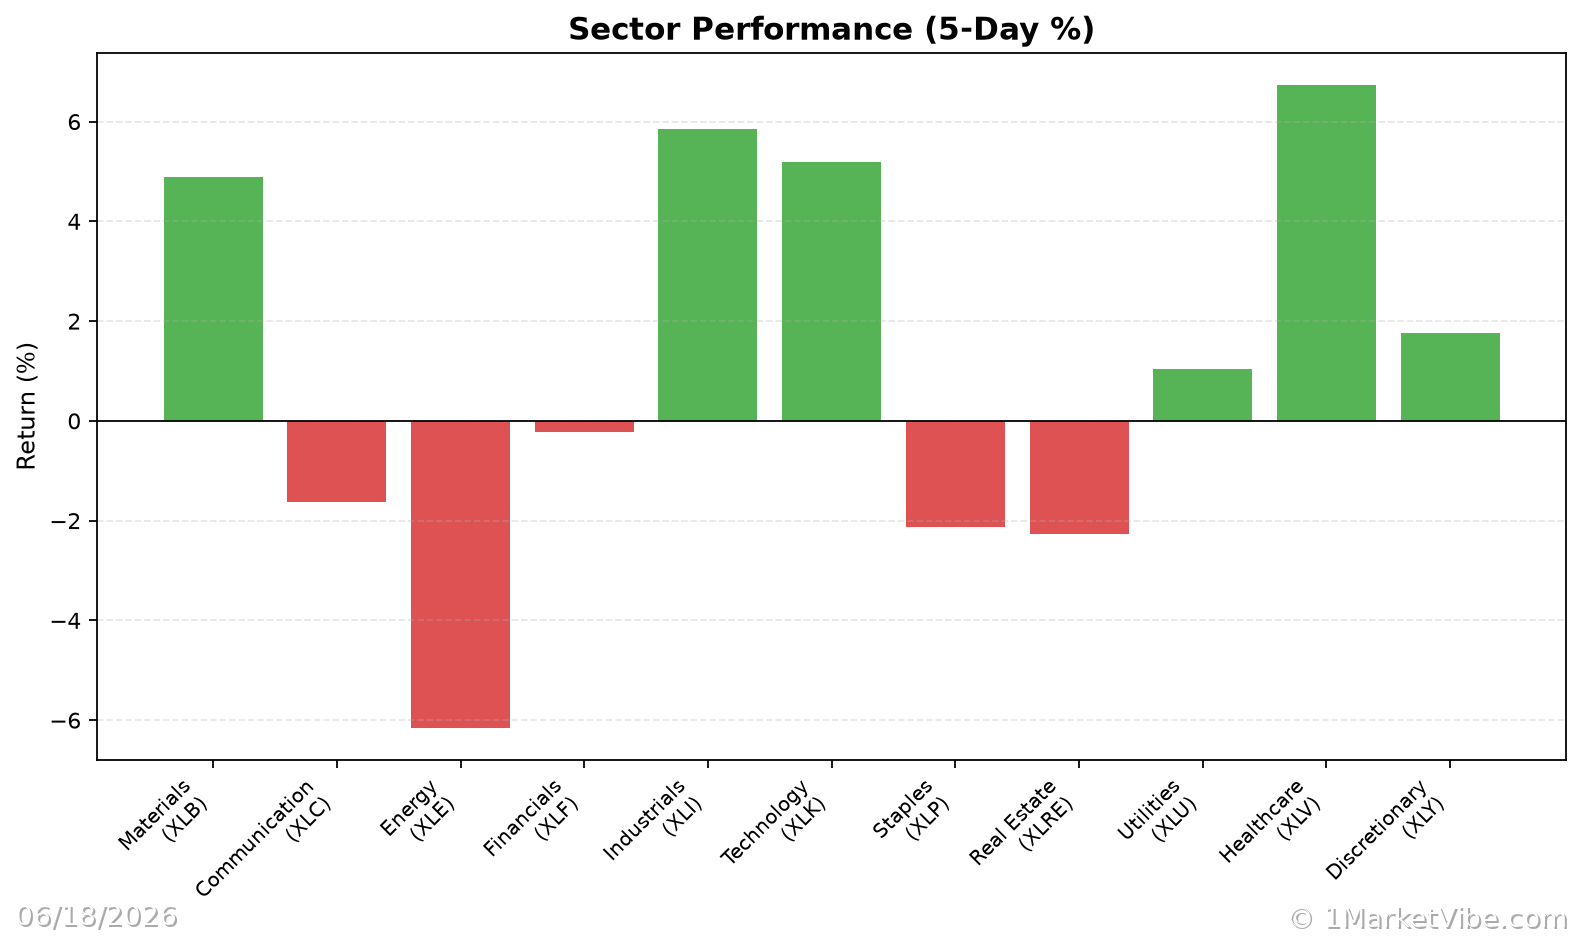
Market reactions to the Fed's hawkish tone have been swift, with increased bets on future rate hikes. This expectation is reflected in the rising Treasury yields, which indicate higher borrowing costs. As a result, sectors sensitive to interest rates, such as real estate and utilities, may experience heightened volatility. Traders need to be aware of these dynamics to make informed decisions about their portfolio allocations.
Market Reactions
Despite the Fed's hawkish stance, Asian stocks have shown resilience, highlighting regional differences in market responses. In contrast, U.S. markets have experienced declines, particularly in technology stocks. This divergence underscores the need for traders to consider global market trends and their potential impact on domestic investments.
Volatility Concerns
Historically, rate hikes have been associated with increased market volatility. The Average True Range Percentage (ATR%) is a useful metric for gauging this volatility. ATR% measures the average range of price movement relative to the price itself, providing insight into market stability. A rising ATR% often signals choppy or unstable market conditions, which can be exacerbated by hawkish Fed policies.
CW Index Connection
The Crash Warning Index (CWI) is another critical tool for assessing market risk. Currently reading at 5.2, the CWI suggests elevated risk levels, aligning with the Fed's hawkish signals. CWI is a composite measure that incorporates various risk dimensions, including breadth, volatility, and defensive behavior. When the CWI is above 6, it typically indicates heightened correction risks, prompting traders to adopt a more defensive posture.
Real-World Scenarios
Scenario 1: Topping Environment
Imagine a scenario where the market index continues to rise, but the % Above 50-DMA (a breadth indicator showing the percentage of stocks above their 50-day moving average) begins to decline. This divergence can signal a topping environment, where underlying market strength is weakening despite apparent gains. Traders might feel tempted to chase the rally, but a more informed approach would involve caution and potential profit-taking.
Scenario 2: Bull Leg Surge
In a strong bull market leg, the % Above 50-DMA might surge and remain elevated, indicating robust market health. During such times, traders can consider increasing exposure, provided their setups align with broader market trends. This scenario emphasizes the importance of aligning individual trades with overall market strength.
Scenario 3: Volatility Spike
A sudden spike in volatility, as indicated by a rising ATR%, can catch traders off guard. In such cases, the CWI might also accelerate, signaling increased risk. Traders often react by reducing exposure or implementing hedging strategies to protect against potential downturns. Understanding these metrics helps traders manage their risk effectively.
How to Use This Insight in a Process
To incorporate these insights into a trading process, consider the following guidelines:
- When breadth is weak and CWI is high, emphasize defense and reduce new risk.
- When breadth and leadership broaden out, be open to adding exposure if setups are favorable.
- Use the Market Dashboard as a high-level regime label, then check internals for confirmation.
These strategies help traders maintain a balanced risk posture, adapting to changing market conditions without relying on precise timing.
Common Misuses & Misconceptions
Traders often misuse market metrics by:
- Treating them as stand-alone entry signals: Metrics should guide risk posture, not dictate specific trades.
- Ignoring context: Consider sector rotation and time frame when interpreting metrics.
- Overreacting to one-day changes: Focus on trends and sustained signals rather than daily fluctuations.
A healthier approach involves integrating these metrics into a broader market analysis framework, ensuring decisions are informed by a comprehensive view of market conditions.
To see these breadth and risk metrics in one place each day, you can use the Decision Edge dashboard at 1marketvibe.com.
DISCLAIMER: This article is for informational purposes only and does not constitute financial advice. Always consult with a financial advisor before making investment decisions.