GM's AI Strategy and Its Impact on Future Job Markets
Introduction
In recent years, General Motors (GM) has been at the forefront of integrating artificial intelligence (AI) into its operations. This strategic shift is not just about enhancing manufacturing efficiency but also about redefining the workforce landscape. Understanding GM's AI strategy is crucial for traders and investors as it provides insights into broader market trends, potential risks, and opportunities. This article will explore GM's AI strategy, its implications for future job markets, and how traders can use MarketVibe's metrics to navigate these changes.
AI's Growing Role
AI in Automotive Industry: GM's adoption of AI technologies is part of a larger trend within the automotive industry. AI is being used to improve vehicle design, optimize supply chains, and enhance customer experiences. For traders, this signifies a shift in how value is created within the industry, highlighting the importance of innovation and technological adoption.
Why Traders Should Care: Understanding GM's AI strategy helps traders anticipate shifts in labor markets and sector performance. It informs decisions about which sectors may experience growth or contraction, aiding in portfolio diversification and risk management.
Impact on Job Markets
Automation and Employment: As AI technologies become more prevalent, certain job roles may become obsolete, while new opportunities in AI development and maintenance emerge. This shift can lead to significant changes in employment patterns, impacting consumer spending and economic growth.
Breadth and Volatility: MarketVibe's % Above 50-DMA and ATR% metrics can provide insights into how these employment shifts affect market stability. A decrease in employment in traditional roles may lead to market volatility, while growth in AI-related jobs could stabilize certain sectors.
Innovation Drivers
GM's Strategic Focus: GM's AI strategy focuses on enhancing vehicle autonomy, improving production efficiency, and developing new business models. This focus on innovation can drive sector leadership, influencing MarketVibe's Sector Scores and providing traders with insights into emerging market leaders.
Market Dashboard States: By monitoring the Market Dashboard, traders can assess the broader market's risk posture and identify when GM's innovations are likely to influence market trends.
Current Industry Trends
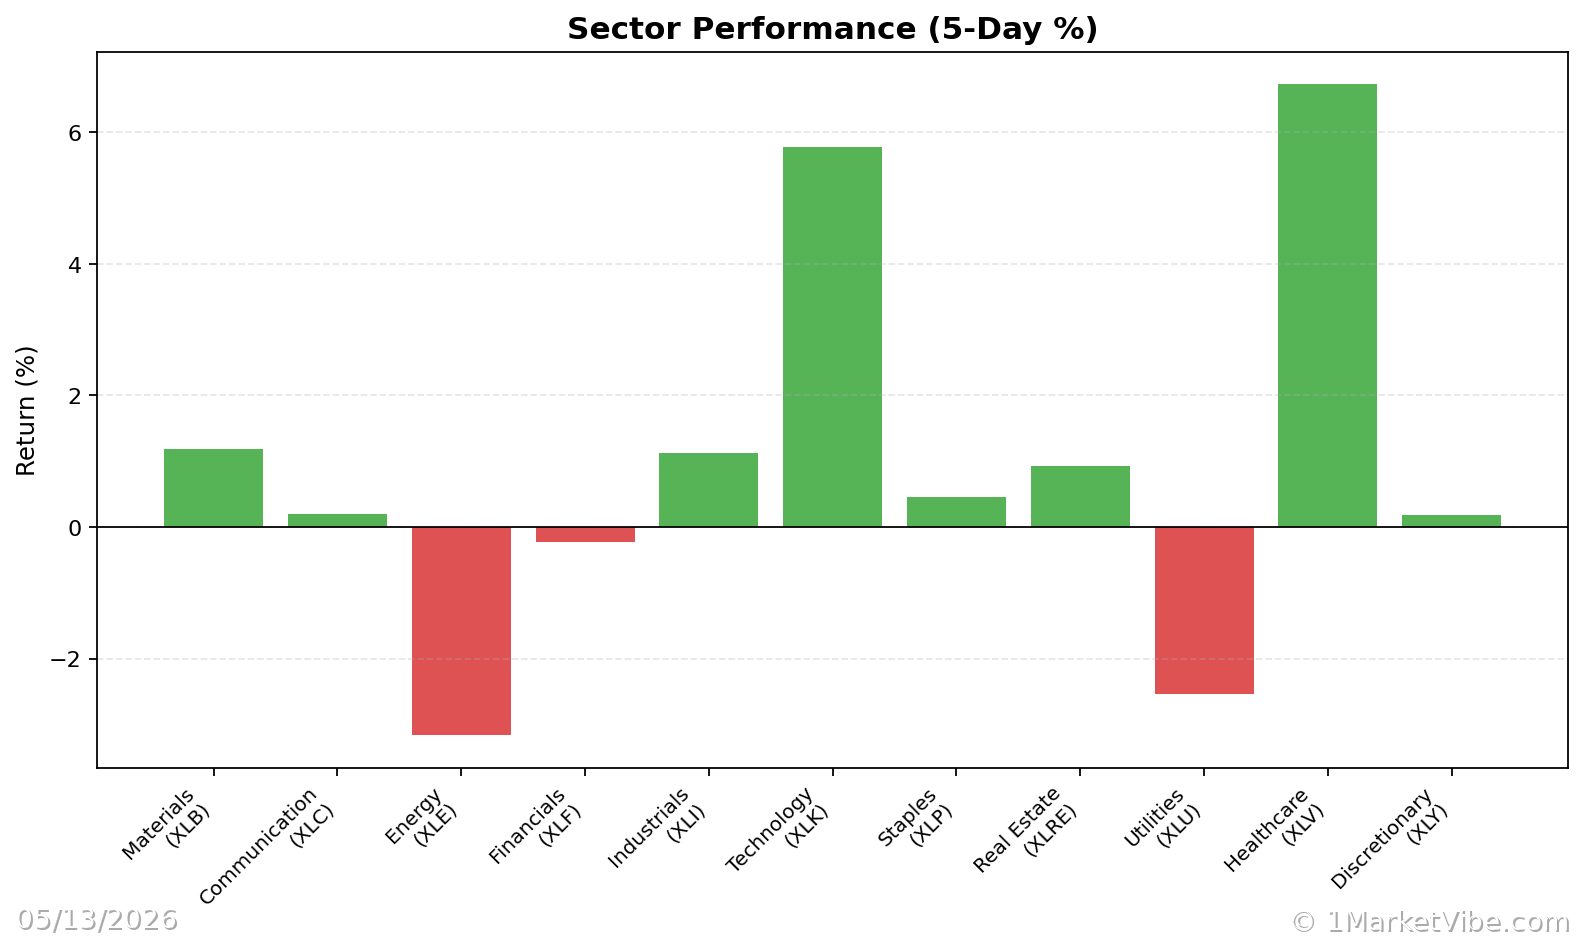
Sector Rotation: As AI technologies reshape industries, traders should pay attention to sector rotation. MarketVibe's Sector Scores can help identify which sectors are gaining or losing momentum, allowing traders to adjust their portfolios accordingly.
CWI and Risk Assessment: The Crash Warning Index (CWI), currently reading 5.8, suggests elevated risk levels. This aligns with the potential disruptions AI could cause in job markets, highlighting the importance of cautious risk management.
CW Index Connection
Predictive Capabilities: The CWI's ability to provide early warnings (4-6 weeks ahead) can help traders anticipate market shifts related to AI developments. A CWI reading above 6 indicates heightened risk, suggesting traders should be prepared for potential corrections.
Decision Edge Framework: Using the Decision Edge framework, traders can integrate CWI insights with other MarketVibe metrics to form a comprehensive view of market conditions and adjust their strategies accordingly.
Potential Risks
Market Volatility: AI-driven changes in employment and sector performance can lead to increased market volatility. Monitoring ATR% can help traders identify when volatility is rising, allowing them to adjust their risk exposure.
Defensive Strategies: In times of elevated CWI and market volatility, traders should consider defensive strategies, such as reducing exposure to high-risk sectors and increasing allocations to stable, defensive sectors.
Real-World Scenarios
Scenario 1: Topping Environment: Imagine a scenario where the overall market index is rising, but the % Above 50-DMA is declining. This could indicate a topping environment where breadth is weakening. Traders might be tempted to chase the rally, but a more informed view would suggest caution and potentially reducing exposure.
Scenario 2: Bull Leg Surge: In a strong bull market, the % Above 50-DMA might surge and remain elevated. This suggests robust market health, allowing traders to consider increasing exposure, provided their setups align with this trend.
Scenario 3: Volatility Spike: A sudden increase in ATR% could signal a volatility spike, often accompanied by a rising CWI. In such cases, traders should reassess their risk posture and consider hedging strategies to protect against potential downturns.
How to Use This Insight in a Process
Practical Guidelines:
- Weak Breadth and High CWI: Emphasize defense and reduce new risk exposure when market breadth is weak, and CWI is high.
- Broadening Breadth and Leadership: Be open to adding exposure when breadth and leadership broaden, but ensure setups are favorable.
- Market Dashboard as a Guide: Use the Market Dashboard for a high-level regime label, then confirm with internal metrics.
Common Misuses & Misconceptions
Standalone Signal Misuse: Traders often misuse metrics like the CWI as standalone entry signals. Instead, use them as part of a broader risk assessment framework.
Ignoring Context: Focusing solely on one metric without considering sector rotation or time frames can lead to misguided decisions. Always consider the broader market context.
Overreacting to Daily Changes: Reacting to one-day changes in metrics can lead to unnecessary trading. Focus on trends and sustained signals for better decision-making.
To see these breadth and risk metrics in one place each day, you can use the Decision Edge dashboard at 1marketvibe.com.
Disclaimer: This article is for informational purposes only and does not constitute financial advice. Market conditions can change rapidly, and past performance is not indicative of future results.
Charts