


Fed's Key Strategies Amid Rising Market Risks
In today's complex financial landscape, understanding the Federal Reserve's strategies can be crucial for traders navigating rising market risks. This article will delve into the Fed's key strategies and how they interact with MarketVibe's metrics, such as the Crash Warning Index (CWI), % Above 50-DMA, and ATR%, to provide a comprehensive view of market conditions and risk management.
Orientation – What Are We Explaining?
The Crash Warning Index (CWI) is a composite indicator designed to signal elevated market risk. It integrates various dimensions, including market breadth, volatility, and defensive behavior. Traders should care about the CWI because it helps inform decisions about risk exposure and portfolio adjustments. It reduces blind spots by offering a structured view of market conditions, rather than relying on gut feelings or isolated signals.
How It Works – Mechanics & Data
Crash Warning Index (CWI)
The CWI is constructed by combining several market indicators that reflect different aspects of risk:
- Breadth Indicators: These include metrics like the % Above 50-DMA, which measures the percentage of stocks trading above their 50-day moving average. A higher percentage indicates strong market breadth and trend health.
- Volatility Measures: The ATR% (Average True Range as a percentage of price) gauges market volatility. Higher ATR% values suggest more volatile and potentially unstable market conditions.
- Defensive Behavior: This component assesses the relative performance of defensive sectors compared to the broader market.
The CWI moves daily based on changes in these underlying components. For example, a surge in market volatility or a decline in breadth could push the CWI higher, signaling increased risk.
Interpretation – What Different Levels Tend to Mean
- CWI Below 3: Generally indicates a stable market environment with low risk. Traders might consider maintaining or increasing exposure.
- CWI Between 3 and 6: Suggests caution. The market may be entering a riskier phase, and traders should be vigilant.
- CWI Above 6: Signals elevated risk. Corrections become more likely, and a defensive posture is advisable.
Common Combinations
- Strong Breadth + Low Volatility: Typically a bullish environment, conducive to taking on more risk.
- Weak Breadth + Rising Volatility: Indicates potential market stress, warranting a defensive strategy.
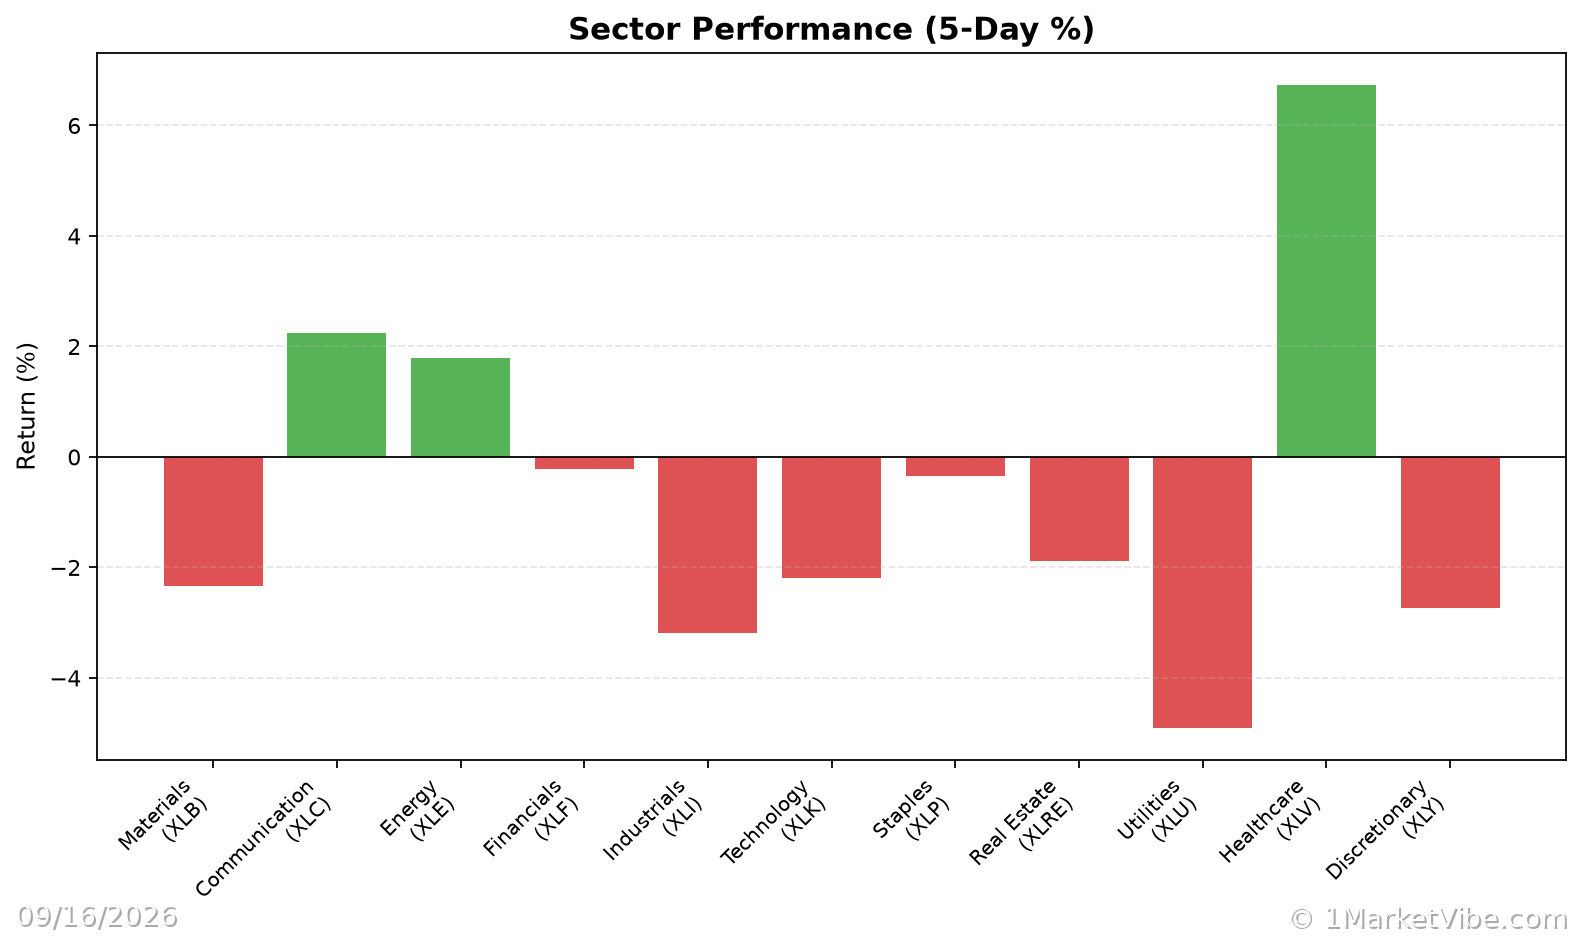
- Defensive Sectors Leading: When defensive sectors outperform, it often aligns with a high CWI, suggesting caution.
Real-World Scenarios – How This Shows Up in Markets
Scenario 1: Topping Environment
Imagine a scenario where the market index continues to rise, but the % Above 50-DMA declines from 70% to 50%. At the same time, the CWI climbs from 4 to 6. This divergence suggests underlying weakness, even as prices rise. Traders might feel tempted to chase the rally, but a more informed view would recommend caution and possibly reducing exposure.
Scenario 2: New Bull Leg
In a strong bull market, the % Above 50-DMA might surge to 80% and remain elevated. The CWI stays below 3, indicating low risk. Traders can be more open to adding exposure, provided their setups are favorable.
Scenario 3: Volatility Spike
During a market correction, the ATR% jumps from 1% to 2.5%, and the CWI spikes above 6. This environment is characterized by high volatility and increased risk. Traders might consider hedging strategies or reducing position sizes to manage risk.
How to Use This Insight in a Process
- When Breadth is Weak and CWI is High: Emphasize defense and reduce new risk. Consider reallocating to more stable assets or sectors.
- When Breadth and Leadership Broaden Out: Be more open to adding exposure, but ensure your setups align with your strategy.
- Use the Market Dashboard: As a high-level regime label, then check internals for confirmation. This helps maintain a structured approach to risk management.
Common Misuses & Misconceptions
Treating CWI as a Stand-Alone Entry Signal: The CWI should guide risk posture, not precise entry points. Use it in conjunction with other indicators and analysis.
Ignoring Context: Focusing solely on the CWI without considering sector rotation or broader market trends can lead to misinformed decisions.
Overreacting to One-Day Changes: The CWI is more meaningful when viewed over several days or weeks. Avoid making drastic changes based on a single day's movement.
To see these breadth and risk metrics in one place each day, you can use the Decision Edge dashboard at 1marketvibe.com.
Disclaimer: The information provided in this article is for educational purposes only and should not be considered as financial advice. Always conduct your own research or consult with a financial advisor before making investment decisions.