
Fed's Cautious Moves and the Implications of a 0.25% Rate Cut
- Authors

- Name
- MarketVibe Team
- @1marketvibe
Fed's Cautious Moves and the Implications of a 0.25% Rate Cut
1. Orientation – What Are We Explaining?
In this article, we explore the implications of the Federal Reserve's recent decision to cut interest rates by 0.25%. This move, while seemingly small, can have significant impacts on the market's risk environment and traders' decision-making processes. Understanding these implications is crucial for traders who aim to navigate the market with a structured approach, reducing blind spots and making informed decisions.
The rate cut can influence various MarketVibe metrics, such as the Crash Warning Index (CWI), % Above 50-DMA, and ATR%. These indicators help traders assess market breadth, volatility, and overall risk conditions. By integrating these metrics into their process, traders can better gauge when to adjust their risk exposure and position sizing.
2. How It Works – Mechanics & Data
Crash Warning Index (CWI)
The CWI is a composite metric that evaluates several dimensions of market risk, including breadth, volatility, and defensive behavior. It aggregates data from various sources to provide a single risk score. For instance, a CWI reading above 6 suggests elevated risk, indicating that market corrections are more likely.
% Above 50-DMA
This metric measures the percentage of stocks trading above their 50-day moving average within a given universe, typically the S&P 500. It serves as a breadth indicator, reflecting the overall health of the market trend. A higher percentage indicates strong market breadth, while a lower percentage suggests weakness.
ATR%
ATR% measures volatility by expressing the Average True Range (ATR) as a percentage of the current price. It helps traders understand the current volatility regime. Low ATR% often corresponds to stable, trending markets, whereas high ATR% indicates choppy or unstable conditions.
3. Interpretation – What Different Levels Tend to Mean
CWI Levels:
- Below 3: Low risk, conducive to risk-taking.
- 3 to 6: Moderate risk, caution advised.
- Above 6: High risk, defensive stance recommended.
% Above 50-DMA:
- Above 70%: Strong market trend, potential for continued gains.
- 30% to 70%: Neutral, mixed signals.
- Below 30%: Weak trend, potential for further downside.
ATR% Levels:
- Below 1%: Quiet, trending market.
- 1% to 2%: Normal volatility.
- Above 2%: High volatility, potential for rapid price swings.
4. Real-World Scenarios – How This Shows Up in Markets
Scenario 1: Topping Environment
Imagine a scenario where the S&P 500 is near all-time highs, but the % Above 50-DMA is declining from 75% to 40%. Simultaneously, the CWI rises from 3 to 5. This suggests that while the index is strong, underlying breadth is weakening, and risk is increasing. Traders might feel tempted to chase the rally, but a more informed view would advocate caution and possibly reducing exposure.
Scenario 2: New Bull Leg
Consider a period where the market has just rebounded from a correction. The % Above 50-DMA surges from 25% to 80%, and ATR% drops below 1%. This indicates a strong new bull leg with low volatility. Traders might feel hesitant due to recent volatility, but the metrics suggest it's a favorable time to add exposure, provided setups align.
Scenario 3: Volatility Spike
Suppose geopolitical tensions cause a sudden market drop, pushing ATR% from 1.2% to 3%. The CWI jumps from 4 to 7. This environment is marked by high volatility and elevated risk. Traders might panic and sell indiscriminately, but a more measured approach would involve tightening stops and considering hedging strategies.
5. How to Use This Insight in a Process
- Risk Management: When breadth is weak and CWI is high, emphasize defense and reduce new risk. This might involve tightening stops and reducing position sizes.
- Opportunity Identification: When breadth and leadership broaden out, be open to adding exposure if setups are present. Use the Market Dashboard to confirm the regime.
- Volatility Assessment: Use ATR% to gauge the volatility environment. High ATR% suggests caution, while low ATR% may indicate a favorable risk environment.
6. Common Misuses & Misconceptions
- Over-reliance on a Single Metric: Avoid treating any single metric as a stand-alone entry signal. Always consider the broader context.
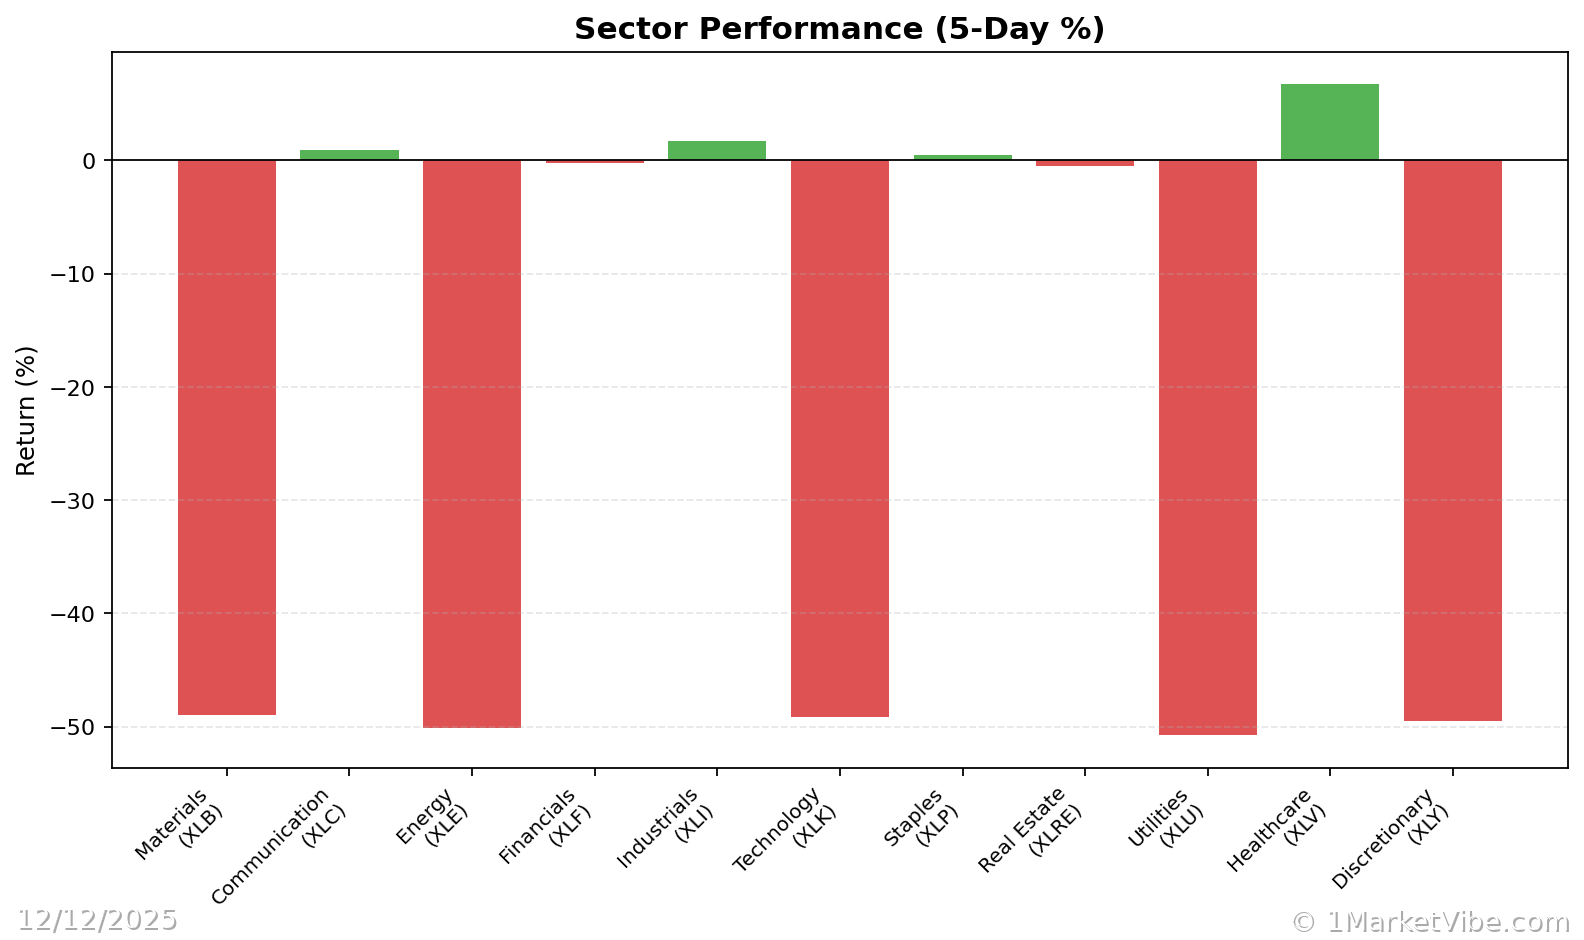
- Ignoring Sector Rotation: Pay attention to sector leadership and rotation, as these can provide additional insights into market dynamics.
- Overreacting to One-Day Changes: Metrics can fluctuate daily; focus on trends and sustained changes rather than knee-jerk reactions.
To see these breadth and risk metrics in one place each day, you can use the Decision Edge dashboard at 1marketvibe.com.
Disclaimer: This article is for informational purposes only and does not constitute financial advice. Trading involves risk, and you should consult with a financial advisor before making any investment decisions.