
Fed Rate Cut Signals Potential Market Stability Risks
The Federal Reserve's decisions on interest rates are pivotal events that can significantly influence market dynamics. When the Fed cuts rates, it often signals an attempt to stimulate economic activity. However, these actions can also introduce potential risks to market stability. Understanding these risks and how they manifest through various market indicators is crucial for traders looking to navigate these turbulent waters effectively.
Current Market Sentiment
Recent market reactions to signals from the Federal Reserve have been mixed. For instance, Asian stock markets have shown varied performances as investors await further clarity on the Fed's policy direction. This uncertainty can lead to increased volatility as traders adjust their positions in anticipation of potential economic shifts.
Fed Rate Cut Expectations
Historically, rate cuts have been used to support economic growth, especially during periods of economic slowdown. However, while they can provide short-term relief, they may also lead to longer-term instability if markets perceive these cuts as a sign of deeper economic issues. Traders should be aware of the historical context and the potential implications of such moves on market stability.
Market Risk Indicators
A key tool for assessing market risk in the context of Fed rate cuts is the Crash Warning Index (CWI). The CWI is a composite metric that incorporates several dimensions of market risk, including breadth, volatility, and defensive behavior. Currently, the CWI reading stands at 5.27, indicating elevated risk levels. This index serves as an early warning system, typically providing insights 4-6 weeks ahead of potential market corrections.
How the CWI Works
The CWI aggregates data from various market indicators to provide a comprehensive risk assessment. It considers factors such as the percentage of stocks trading above their 50-day moving average, the net advance/decline of stocks, and the new highs versus new lows in the market. These components help traders gauge the underlying health of the market and anticipate potential downturns.
Interpretation of CWI Levels
- CWI below 3: Generally indicates a stable market environment with lower risk of correction.
- CWI between 3 and 6: Signals a heightened risk environment where caution is advised.
- CWI above 6: Suggests a high probability of market correction, prompting defensive strategies.
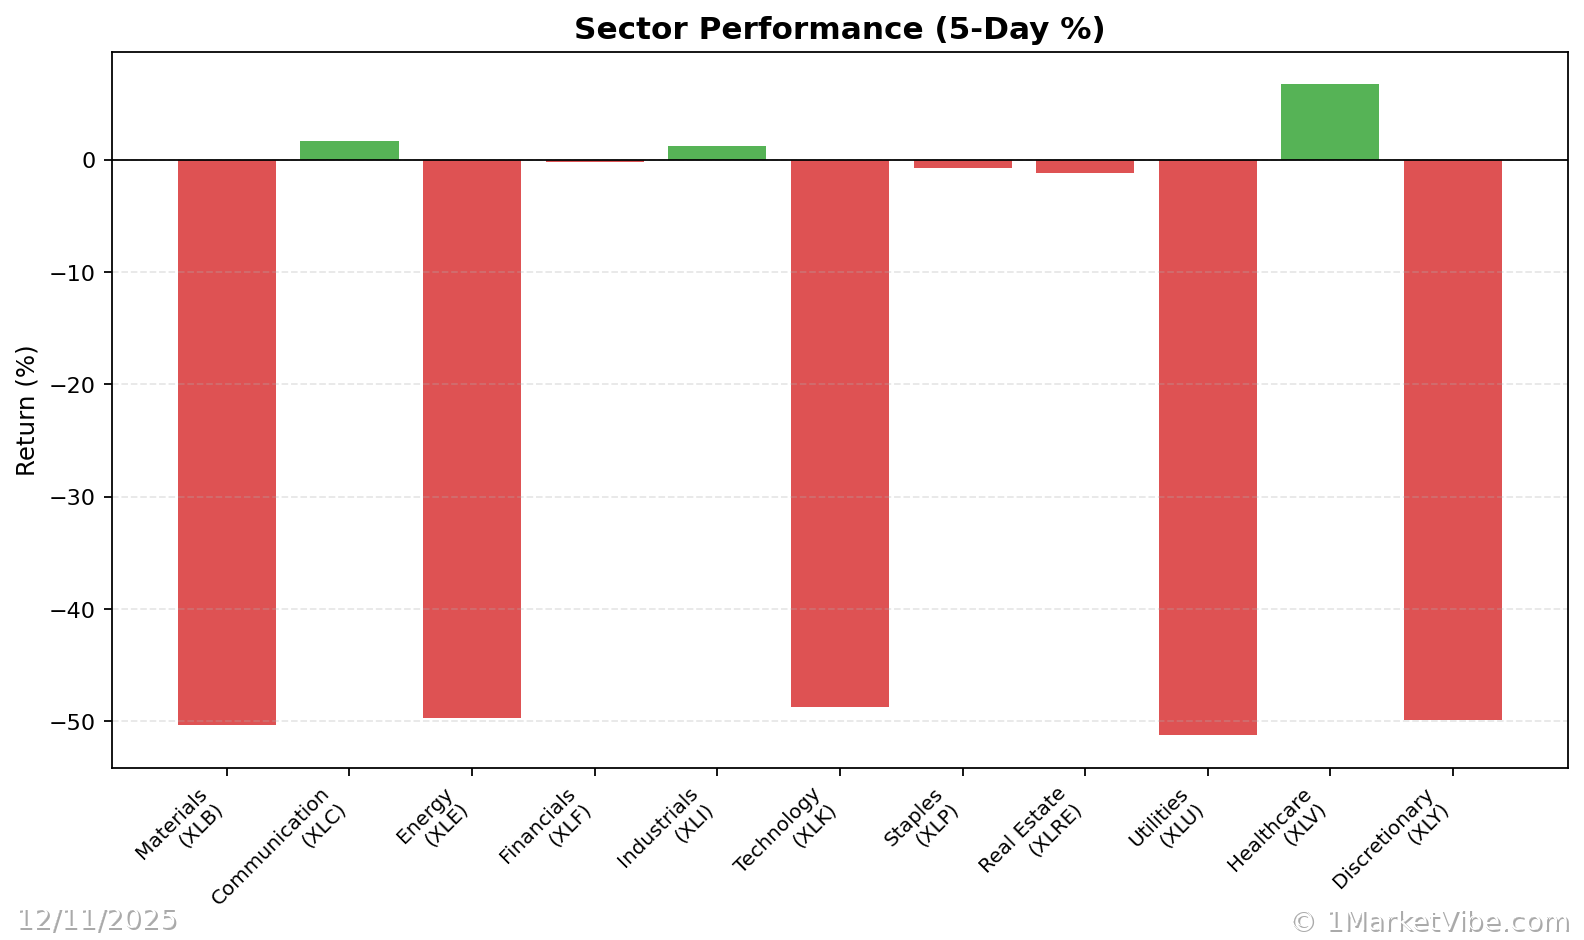
Sector-Specific Impacts
Different market sectors may respond uniquely to Fed rate cuts. For example, financials might face pressure due to narrowing interest margins, while consumer discretionary sectors could benefit from increased consumer spending. Understanding these sector-specific dynamics is essential for traders looking to adjust their portfolios in response to rate changes.
Real-World Scenarios
Scenario 1: Topping Environment
In a topping environment, the market index might continue to rise even as breadth deteriorates. For instance, if the percentage of stocks above their 50-day moving average falls below 40%, while the index grinds higher, it suggests underlying weakness. Traders might be tempted to chase the rally, but a more informed view would emphasize caution and potential profit-taking.
Scenario 2: Bull Market Leg
During a strong bull market leg, the percentage of stocks above their 50-day moving average might surge above 70% and remain elevated. This scenario indicates robust market health and broad participation, allowing traders to consider increasing exposure, provided their setups align with the broader trend.
Scenario 3: Volatility Spike
A sudden increase in volatility, reflected by a jump in the Average True Range (ATR%) metric, can coincide with a rising CWI. This combination often signals a turbulent market phase, where traders should focus on risk management and possibly reduce exposure to high-beta stocks.
How to Use This Insight in a Process
To effectively incorporate these insights into a trading process, consider the following guidelines:
- Emphasize Defense: When breadth is weak and the CWI is high, prioritize defensive strategies and reduce new risk exposure.
- Broaden Exposure with Caution: If breadth and leadership improve, consider adding exposure, but ensure that your setups are robust and align with the broader market trend.
- Use Market Dashboard: Leverage the Market Dashboard as a high-level regime label, then delve into internals for confirmation and fine-tuning of your strategy.
Common Misuses & Misconceptions
Traders often misuse market indicators by:
- Treating them as stand-alone signals: Indicators should guide risk posture, not dictate precise entry or exit points.
- Ignoring context: Always consider sector rotation and broader market conditions when interpreting indicators.
- Overreacting to one-day changes: Focus on trends and sustained movements rather than reacting to daily fluctuations.
To see these breadth and risk metrics in one place each day, you can use the Decision Edge dashboard at 1marketvibe.com.
DISCLAIMER: This article is for informational purposes only and should not be considered financial advice. Always conduct your own research before making investment decisions.