

Fed Chair Confirmation and the Implications of Delayed Rate Cuts for Investors
- Authors

- Name
- MarketVibe Team
- @1marketvibe
Fed Chair Confirmation and the Implications of Delayed Rate Cuts for Investors
The recent confirmation of Kevin Warsh as the new Federal Reserve Chair has stirred discussions among investors and policymakers alike. This development comes at a time when the market is closely watching for signals about future monetary policy, particularly regarding interest rate cuts. Understanding the implications of these potential changes is crucial for investors looking to navigate the current economic landscape.
Warsh's Vision for the Fed
Kevin Warsh has expressed a commitment to reforming the central bank, potentially signaling shifts in monetary policy direction. His leadership could bring changes that affect how the Fed approaches inflation, growth, and interest rates. Traders should be aware that such shifts can influence market dynamics significantly, impacting everything from stock prices to bond yields.
Political Landscape
Warsh's confirmation was marked by a near party-line vote, highlighting the deep political divisions that now influence economic policy decisions. These divisions can lead to uncertainty in the market, as different political agendas may push for varying economic strategies. Investors need to be mindful of how these political factors might affect the Fed's policy decisions and, consequently, market conditions.
Market Reactions
Investor sentiment regarding Warsh's confirmation has been mixed. While some see his appointment as a stabilizing factor, others are concerned about the potential delay in rate cuts. This uncertainty can lead to increased market volatility, as traders speculate about the Fed's next moves. Monitoring market reactions through metrics like the Average True Range Percentage (ATR%), which measures volatility relative to price, can provide insights into the current volatility regime.
Trump Allies' Concerns
Allies of former President Trump have expressed concerns about delaying rate cuts, warning that such delays could impact investor confidence and market performance. The Crash Warning Index (CWI), a composite metric that includes factors like breadth and volatility, can help investors gauge the risk of significant market corrections. A high CWI suggests elevated risk, prompting traders to consider defensive strategies.
Rate Cut Speculations
Discussions around potential rate cuts are ongoing, with some arguing that premature monetary easing could pose risks. Investors should pay attention to the % Above 50-DMA, which indicates the percentage of stocks trading above their 50-day moving average. This metric serves as a breadth indicator, reflecting the overall health of market trends. A low percentage might suggest that the market is weak or oversold, while a high percentage indicates strength.
Economic Implications
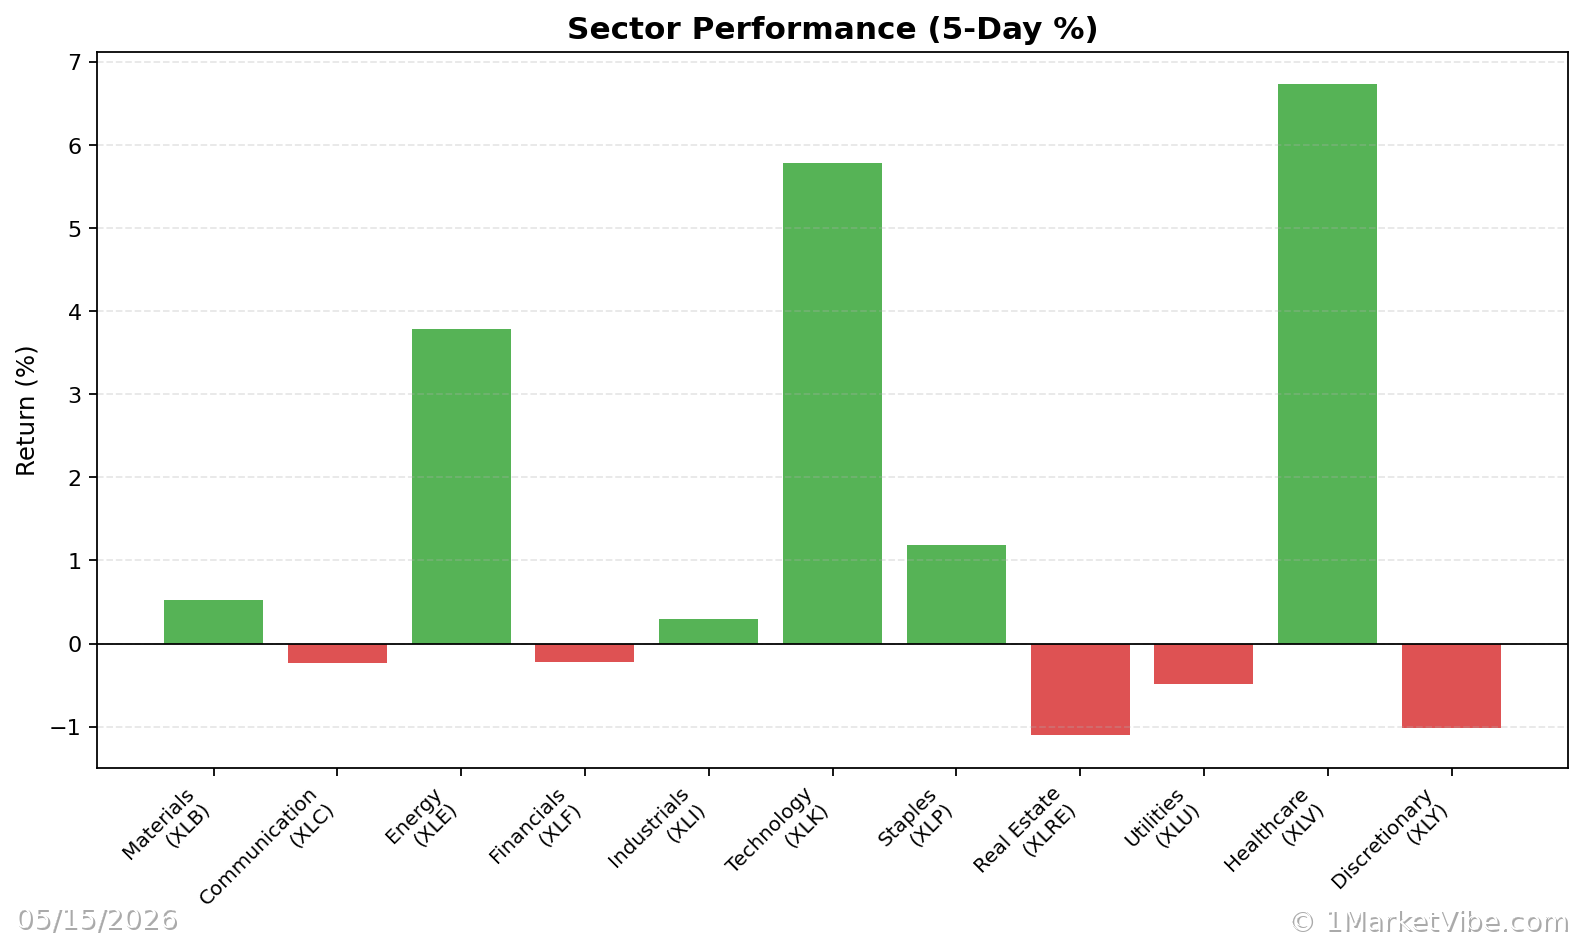
Warsh's policies could have significant effects on inflation and growth. A focus on controlling inflation might lead to tighter monetary policy, affecting sectors differently. For instance, interest-rate-sensitive sectors like real estate and utilities could experience more volatility. The New High–New Low (NH–NL) indicator can help investors identify sector rotations and leadership changes, providing clues about where the market might be headed.
Real-World Scenarios
Topping Environment: Imagine a scenario where the market index continues to rise, but the % Above 50-DMA starts to decline. This divergence often signals a weakening breadth, suggesting that fewer stocks are participating in the rally. Traders might feel tempted to chase the rally, but a more informed view would emphasize caution, as the underlying strength is deteriorating.
Volatility Spike: Suppose the ATR% jumps significantly, indicating a spike in volatility. This could occur in response to unexpected news about rate cuts or other economic policies. Traders might react by reducing exposure to riskier assets, but those using MarketVibe's metrics would look for confirmation from the CWI and A/D Net (Advances/Declines Net) to assess the broader market risk.
Bull Leg Strength: In a strong bull market leg, the % Above 50-DMA might surge and remain elevated, indicating robust market breadth. Traders could be tempted to increase exposure, but it's crucial to ensure that setups align with broader market conditions. Monitoring sector scores for leadership and rotation can provide additional context.
How to Use This Insight in a Process
- Risk Management: When breadth is weak and the CWI is high, emphasize defensive strategies and reduce new risk exposure. This approach helps protect capital during uncertain times.
- Opportunistic Exposure: If breadth and leadership broaden, consider adding exposure, but only if your trading setups are favorable. Use the Market Dashboard to confirm the overall market climate.
- Volatility Awareness: Use the ATR% to gauge the current volatility regime. Low volatility might suggest a trending phase, while high volatility indicates potential instability.
Common Misuses & Misconceptions
- Standalone Signal: Avoid treating any single metric, like the % Above 50-DMA, as a standalone entry signal. Always consider the broader market context and other confirming indicators.
- Ignoring Context: Don't ignore sector rotation or time frame when interpreting metrics. A sector leading in a weak market might not indicate overall strength.
- Overreacting to Daily Changes: Resist the urge to overreact to one-day changes in metrics. Look for sustained trends and confirm with multiple data points.
To see these breadth and risk metrics in one place each day, you can use the Decision Edge dashboard at 1marketvibe.com.
This article is for informational purposes only and does not constitute financial advice. Always consult with a financial advisor before making investment decisions.