
Election Drives Surge in Japanese Stocks and Its Implications for U.S. Yields
- Authors

- Name
- MarketVibe Team
- @1marketvibe
Election Drives Surge in Japanese Stocks and Its Implications for U.S. Yields
The recent landslide election victory of Prime Minister Sanae Takaichi in Japan has sparked significant movements in the financial markets, particularly in Japanese stocks and U.S. yields. This article will explore the underlying dynamics of these changes, using MarketVibe's metrics to provide a clearer understanding of the market's behavior and how traders can adjust their strategies accordingly.
Orientation – What Are We Explaining?
In this article, we focus on understanding the implications of political events, like Japan's election, on market movements and how these can be analyzed using MarketVibe's metrics. Specifically, we will look at how the Crash Warning Index (CWI) and Market Dashboard can help traders assess risk and make informed decisions.
Why Traders Should Care:
- Political events can lead to significant shifts in market sentiment and price movements.
- Understanding these shifts can help traders manage risk and position themselves advantageously.
- MarketVibe's metrics provide a structured way to interpret these changes, reducing blind spots and improving decision-making processes.
How It Works – Mechanics & Data
Crash Warning Index (CWI)
The Crash Warning Index (CWI) is a composite metric designed to gauge the risk of significant market corrections. It incorporates several dimensions, including market breadth, volatility, and defensive behavior. A CWI reading of 5.8, as observed currently, suggests elevated risk, indicating that traders should be cautious about potential market corrections.
Construction of CWI:
- Breadth: Measures the percentage of stocks above their 50-day moving average, indicating trend health.
- Volatility: Assessed through metrics like ATR% (Average True Range as a percentage of price), which indicates market stability.
- Defensive Behavior: Observed through sector rotation, where a shift towards defensive sectors can signal increased risk aversion.
Market Dashboard
The Market Dashboard provides a snapshot of the overall market climate, helping traders understand the current risk regime. It combines insights from various MarketVibe metrics, offering a high-level view of market conditions.
Day-to-Day Movements:
- Political stability, like Japan's recent election, can lead to increased investor confidence, reflected in stock surges.
- Changes in currency values, such as the yen's movement against the dollar, can affect international trade dynamics and, consequently, market behavior.
Interpretation – What Different Levels Tend to Mean
CWI Levels
- Below 3: Indicates low risk, with markets generally stable and trending.
- 3 to 6: Suggests moderate risk, with potential for corrections but not imminent.
- Above 6: High risk, where market corrections are more likely, and traders should be defensive.
Market Dashboard States
- Bullish: Strong breadth and low volatility, indicating a favorable environment for risk-taking.
- Neutral: Mixed signals, requiring careful monitoring of breadth and volatility.
- Bearish: Weak breadth and rising volatility, suggesting a need for caution and defensive positioning.
Real-World Scenarios – How This Shows Up in Markets
Election-Induced Rally:
- Scenario: Following Japan's election, the Nikkei 225 index surged, reflecting increased political stability.
- Metrics: Likely showed strong breadth with a high percentage of stocks above their 50-DMA.
- Trader Response: While tempted to increase exposure, a cautious approach is advised given the elevated CWI.
Currency Fluctuations:
- Scenario: The yen's rise against the dollar impacts U.S. yields, influencing global trade.
- Metrics: Volatility metrics like ATR% may increase, reflecting uncertainty.
- Trader Response: Consider hedging strategies to manage currency risk.
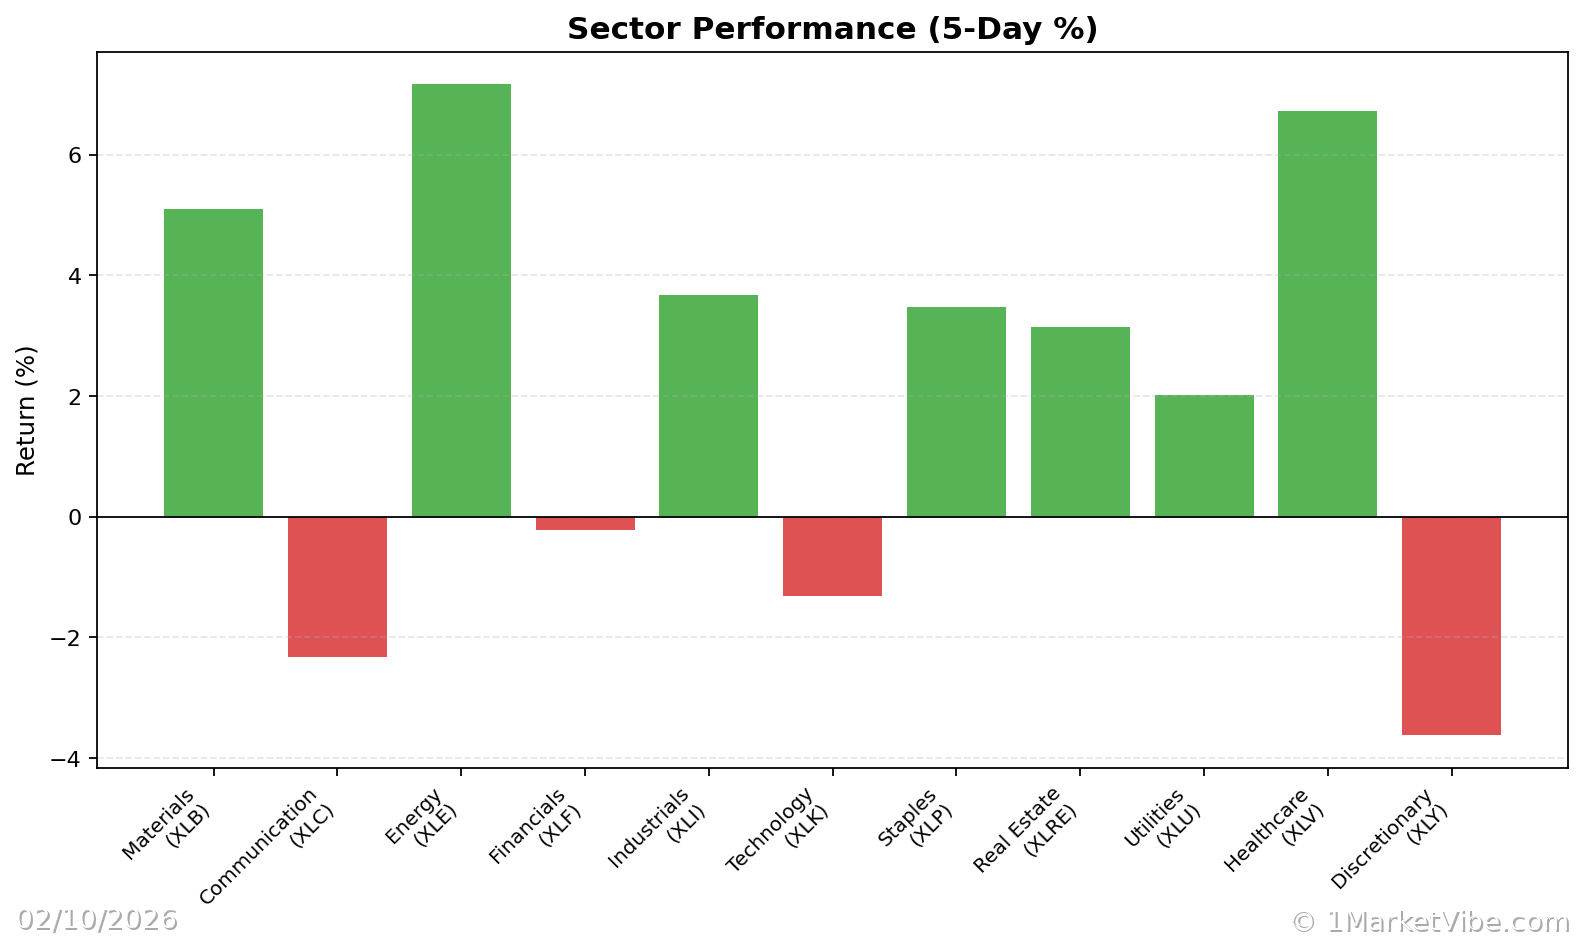
Sector Rotation:
- Scenario: Defensive sectors lead as CWI remains high, indicating risk aversion.
- Metrics: Market Dashboard shows a shift towards defensive positioning.
- Trader Response: Emphasize defensive sectors and reduce exposure to high-risk assets.
How to Use This Insight in a Process
- Risk Management: Use the CWI to adjust position sizing and risk exposure. High CWI levels suggest reducing new risk and focusing on capital preservation.
- Market Monitoring: Regularly check the Market Dashboard for changes in market climate, using it as a guide for overall risk posture.
- Strategic Adjustments: When breadth and leadership broaden, consider increasing exposure, but ensure setups align with your strategy.
Common Misuses & Misconceptions
- Standalone Signals: Avoid using CWI or any single metric as a standalone entry signal. Always consider the broader market context.
- Ignoring Sector Rotation: Failing to account for sector shifts can lead to misguided risk assessments. Monitor sector scores for a comprehensive view.
- Overreacting to Daily Changes: Market metrics can fluctuate daily. Focus on trends and sustained changes rather than reacting to short-term movements.
To see these breadth and risk metrics in one place each day, you can use the Decision Edge dashboard at 1marketvibe.com.
Disclaimer: This article is for informational purposes only and does not constitute financial advice. Please consult with a financial advisor before making any investment decisions.