

Dow Rises 300 Points as CW Index Correlates with Oil Decline
- Authors

- Name
- MarketVibe Team
- @1marketvibe
Understanding the CW Index and Its Role in Market Dynamics
In today's market landscape, the Dow Jones Industrial Average has risen by 300 points, coinciding with a decline in oil prices. This movement has sparked interest in the Crash Warning Index (CWI), a composite metric that provides insights into market risk levels. Understanding the CWI can help traders make informed decisions by highlighting potential market vulnerabilities and opportunities.
Why Traders Should Care About the CW Index
The Crash Warning Index (CWI) is a crucial tool for traders looking to gauge market risk. It combines several dimensions of market behavior, including breadth, volatility, and defensive sector performance, to provide a comprehensive risk assessment. By monitoring the CWI, traders can:
- Inform Decision-Making: The CWI helps traders decide when to adopt a defensive posture or when to take on more risk.
- Reduce Blind Spots: It offers a broader view of market conditions, reducing the likelihood of being caught off guard by sudden market shifts.
- Enhance Process Structure: Rather than relying on gut feelings, traders can incorporate the CWI into a structured decision-making process.
How the CW Index Works
The CWI is constructed by analyzing several market factors:
- Breadth: This measures the number of stocks participating in a market move. A healthy market typically sees a large percentage of stocks above their 50-day moving average (50-DMA).
- Volatility: The CWI considers volatility metrics like the Average True Range (ATR%) to assess market stability.
- Defensive Behavior: It examines the performance of defensive sectors, which tend to outperform during periods of market stress.
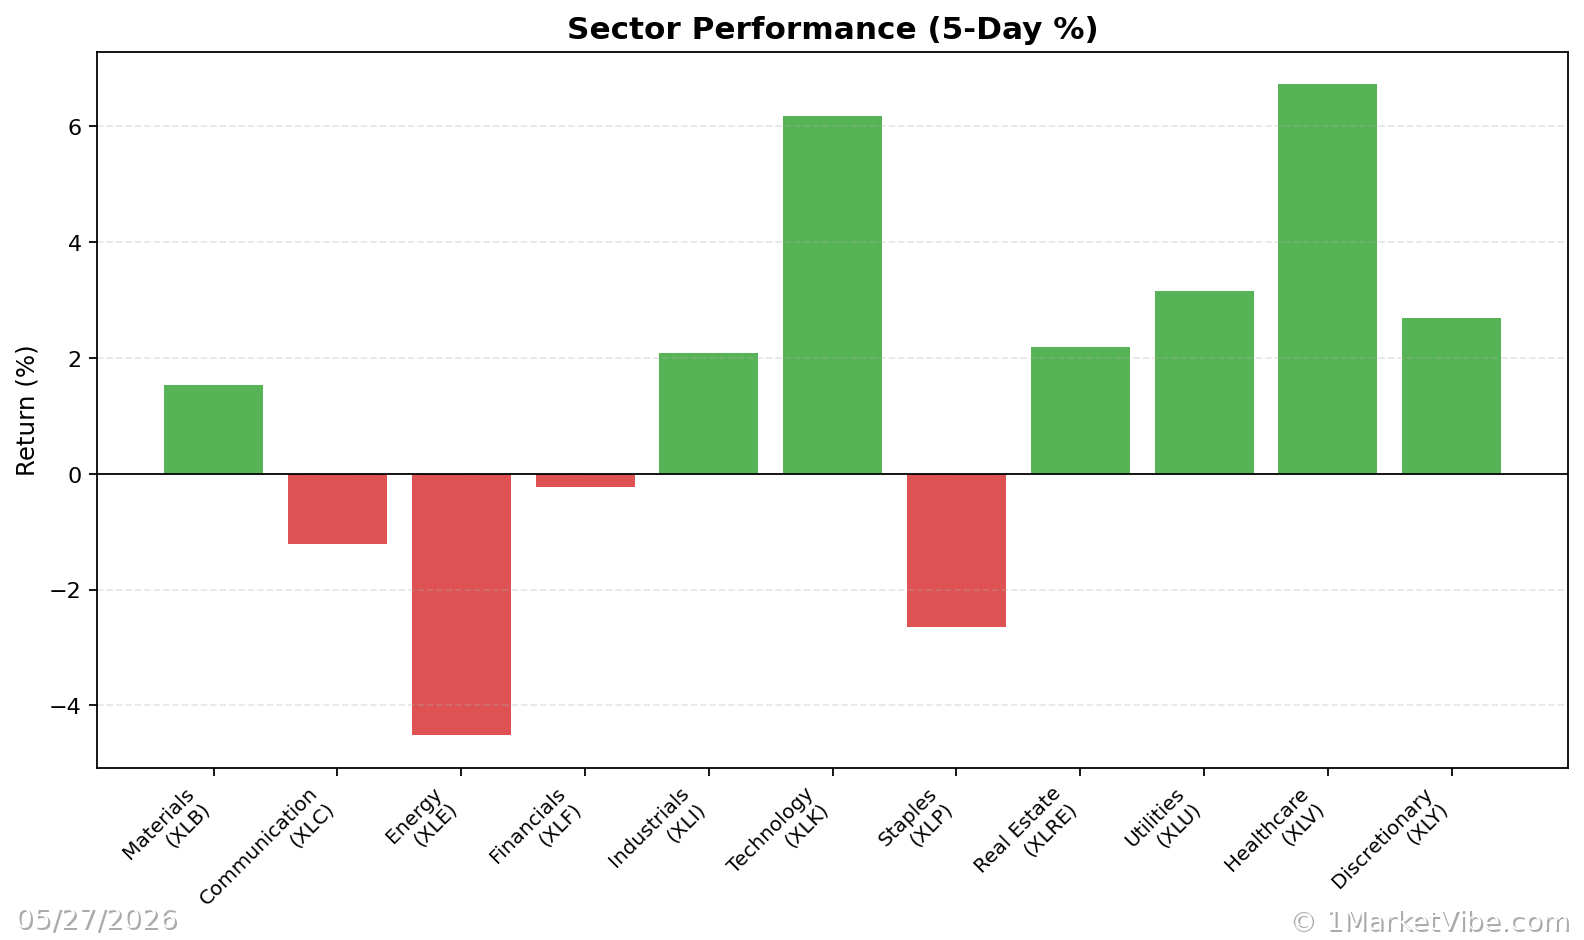
The CWI moves based on changes in these underlying components. For example, if market breadth weakens or volatility increases, the CWI is likely to rise, signaling increased risk.
Interpreting the CW Index
The CWI provides valuable insights into market conditions through its various levels:
- CWI Below 3: Indicates a relatively low-risk environment, suggesting that market conditions are stable.
- CWI Between 3 and 6: Suggests moderate risk, where caution is advised, but opportunities may still exist.
- CWI Above 6: Signals elevated risk, with a higher likelihood of market corrections.
Common combinations of market conditions include:
- Strong Breadth + Low Volatility: Typically indicates a stable, trending market.
- Weak Breadth + Rising Volatility: Often a precursor to market corrections or increased risk.
- Defensive Sectors Leading: Suggests a shift towards risk aversion among investors.
Real-World Scenarios
Let's explore a few scenarios to illustrate how the CWI can manifest in the markets:
Topping Environment: Imagine a scenario where the market index continues to climb, but the percentage of stocks above their 50-DMA declines. The CWI might rise above 6, indicating that despite the index's upward movement, underlying market health is deteriorating. Traders might be tempted to chase the rally, but a more informed approach would be to exercise caution and tighten risk controls.
Bull Market Leg: In a strong bull market, the % Above 50-DMA might surge and remain elevated, keeping the CWI low. This environment suggests robust market health, where traders can consider increasing exposure, provided their setups align with broader market trends.
Volatility Spike: A sudden increase in market volatility, reflected in a rising ATR%, could push the CWI higher. This scenario often leads traders to panic, but a measured response would involve reassessing risk exposure and potentially hedging positions.
How to Use This Insight in a Process
To effectively incorporate the CWI into your trading process, consider the following guidelines:
- Emphasize Defense When Risk is High: If the CWI is elevated, focus on protecting capital by reducing new risk and considering defensive strategies.
- Expand Exposure in Strong Conditions: When breadth and leadership are strong, and the CWI is low, be open to adding exposure, but ensure that your setups are robust.
- Use the Market Dashboard: Leverage MarketVibe's Decision Edge Dashboard to get a high-level view of market regimes and confirm insights with internal metrics.
Common Misuses & Misconceptions
Traders often misuse the CWI in several ways:
- Treating it as a Stand-Alone Signal: The CWI should not be used in isolation. Always consider the broader market context and other indicators.
- Ignoring Sector Rotation: Focusing solely on the CWI without considering sector dynamics can lead to missed opportunities or increased risk.
- Overreacting to One-Day Changes: The CWI is more reliable when observed over several days. Avoid making hasty decisions based on short-term fluctuations.
To see these breadth and risk metrics in one place each day, you can use the Decision Edge dashboard at 1marketvibe.com.
DISCLAIMER: This article is for informational purposes only and should not be considered financial advice. Always conduct your own research before making investment decisions.