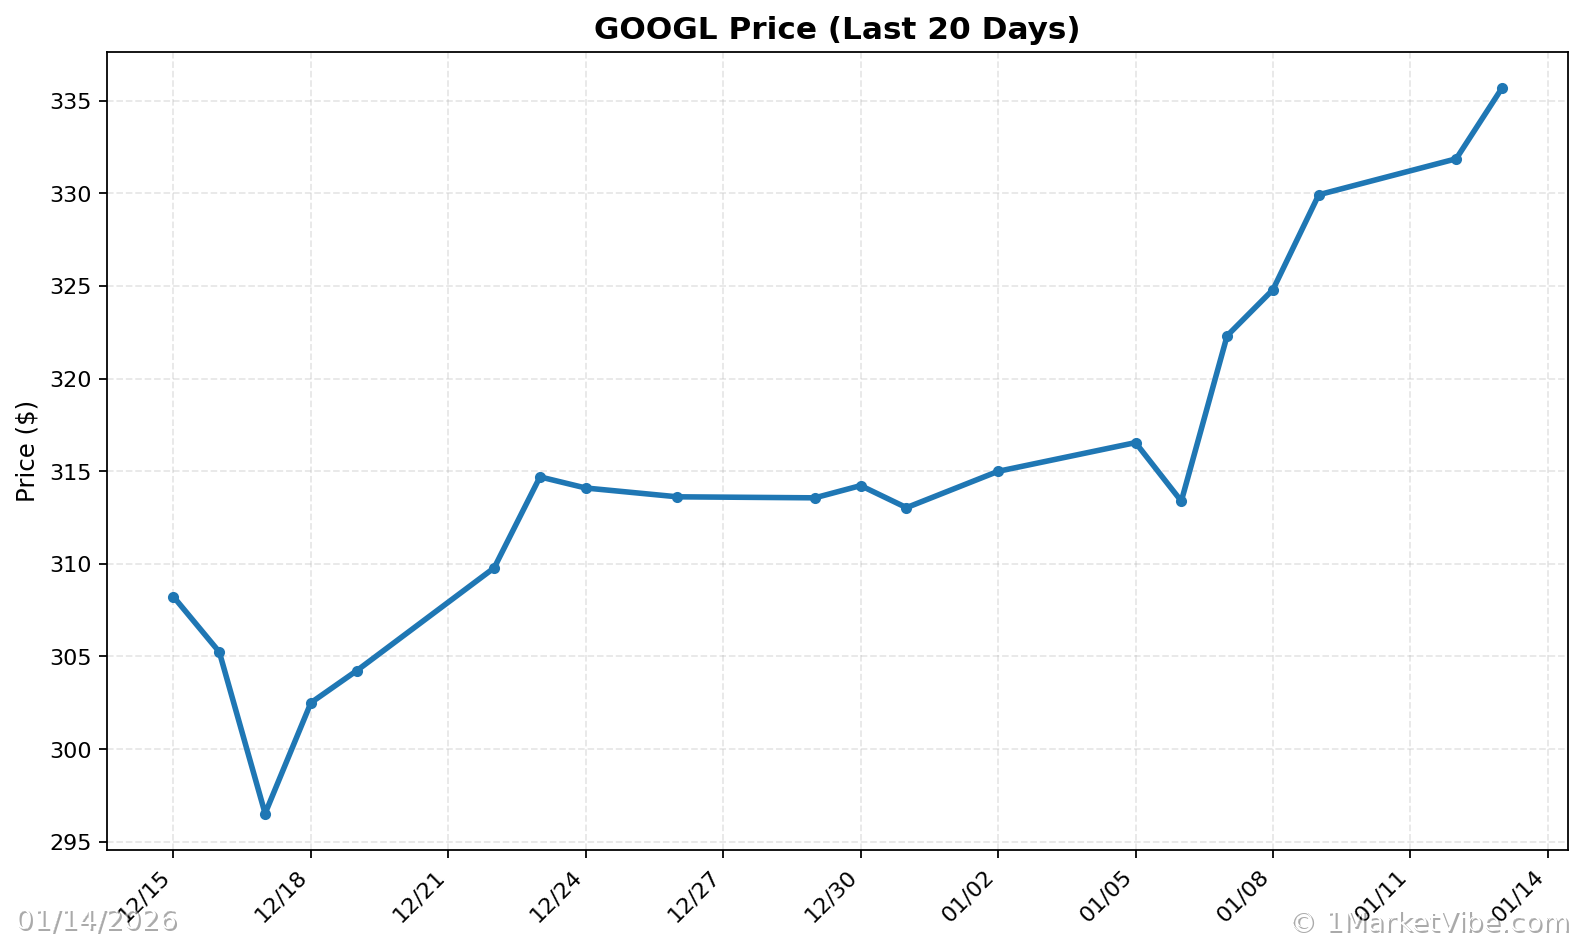
Dow and S&P 500 Surge as Alphabet Reaches $4 Trillion Milestone
- Authors

- Name
- MarketVibe Team
- @1marketvibe
Dow and S&P 500 Surge as Alphabet Reaches $4 Trillion Milestone
The stock market has recently witnessed a significant surge, with the Dow Jones Industrial Average and the S&P 500 reaching record highs. This rally coincides with Alphabet's market capitalization hitting an impressive $4 trillion. While such milestones often spark optimism, it's crucial for traders to understand the underlying market dynamics to make informed decisions. In this article, we'll explore how MarketVibe's metrics can provide insights into the current market environment and help traders navigate potential risks.
Orientation – What Are We Explaining?
Today, we'll focus on the Crash Warning Index (CWI) and its role in assessing market risk. The CWI is a composite indicator that evaluates several dimensions of market risk, including breadth, volatility, and defensive behavior. Traders should care about the CWI because it helps inform decisions about risk management and portfolio adjustments. By understanding the CWI, traders can reduce blind spots related to market complacency and better align their strategies with prevailing conditions.
How It Works – Mechanics & Data
The CWI is constructed by aggregating various market indicators that reflect the health and risk of the market. These include:
- Breadth Indicators: Such as the percentage of stocks above their 50-day moving average (% Above 50-DMA), which measures the trend health across a broad universe of stocks.
- Volatility Metrics: Including the Average True Range percentage (ATR%), which assesses market volatility relative to price.
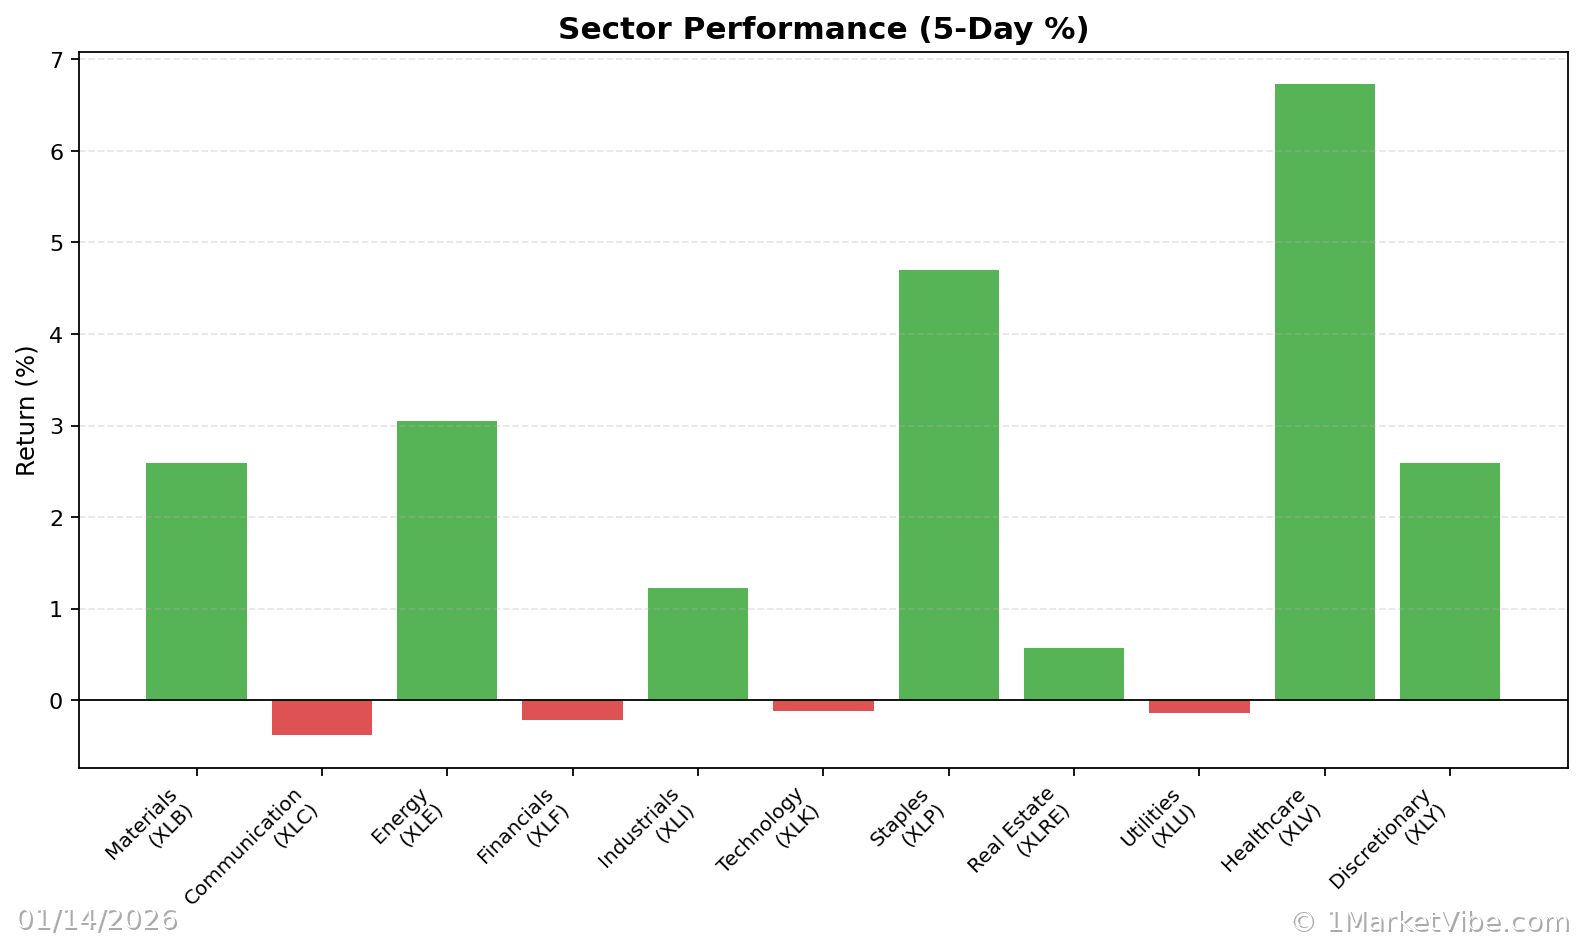
- Defensive Behavior: Observations of sector rotations into defensive areas like utilities or consumer staples.
The CWI moves daily based on changes in these underlying components. For example, a sharp decline in the % Above 50-DMA or a spike in ATR% could elevate the CWI, signaling increased market risk.
Interpretation – What Different Levels Tend to Mean
CWI Ranges and Implications:
- Below 3: Generally indicates a stable market environment with low risk of a significant correction.
- 3 to 6: Suggests caution, as risk factors are starting to accumulate. Traders should be vigilant about potential volatility.
- Above 6: Signals elevated risk, where corrections or downturns become more likely. Defensive strategies may be warranted.
Common Combinations:
- Strong Breadth + Low Volatility: Typically a bullish environment where risk-taking is rewarded.
- Weak Breadth + Rising Volatility: Often precedes market corrections, suggesting a defensive posture.
- Defensive Sectors Leading: When combined with a high CWI, it indicates a risk-off environment.
Real-World Scenarios – How This Shows Up in Markets
Scenario 1: Topping Environment
Imagine a scenario where the S&P 500 continues to rise, but the % Above 50-DMA begins to decline. This divergence suggests that fewer stocks are participating in the rally, potentially indicating a topping environment. Traders might feel tempted to chase the highs, but a more informed view would focus on protecting gains and preparing for a potential pullback.
Scenario 2: Bull Leg with Strong Breadth
In a strong bull market leg, the % Above 50-DMA surges and remains elevated. This indicates broad participation and trend strength. Traders should consider increasing exposure, provided their setups align with the market conditions.
Scenario 3: Volatility Spike
A sudden increase in ATR% alongside a rising CWI suggests a volatility spike. This environment often leads to choppy market conditions. Traders might be tempted to exit positions in panic, but a more measured approach would involve reassessing risk levels and possibly hedging.
How to Use This Insight in a Process
- When Breadth is Weak and CWI is High: Emphasize defense by reducing new risk and focusing on capital preservation.
- When Breadth and Leadership Broaden: Be open to adding exposure, but ensure your setups are robust and align with market trends.
- Use the Market Dashboard: As a high-level regime label, then check internals for confirmation. This structured approach helps maintain discipline and avoid emotional reactions.
Common Misuses & Misconceptions
Treating CWI as a Stand-Alone Entry Signal: The CWI is not a timing tool. It's a risk assessment metric that should guide your overall posture, not dictate specific trades.
Ignoring Context: Focusing solely on the CWI without considering sector rotation or broader economic indicators can lead to misguided decisions. Always incorporate multiple data points.
Overreacting to One-Day Changes: Daily fluctuations in the CWI are normal. Look for sustained trends or significant shifts before adjusting your strategy.
To see these breadth and risk metrics in one place each day, you can use the Decision Edge dashboard at 1marketvibe.com.
DISCLAIMER: This article is for informational purposes only and does not constitute financial advice. Please consult with a financial advisor before making investment decisions.
Charts