
CW Index Reaches 5.91 Amid Geopolitical Market Volatility
- Authors

- Name
- MarketVibe Team
- @1marketvibe
CW Index Reaches 5.91 Amid Geopolitical Market Volatility
1. Orientation – What Are We Explaining?
In this article, we focus on the Crash Warning Index (CWI), which has recently reached a level of 5.91. This metric is crucial for traders as it provides a composite view of market risk by integrating several dimensions such as breadth, volatility, and defensive behavior. Understanding the CWI helps traders make informed decisions about risk management and portfolio adjustments, especially during periods of heightened geopolitical volatility, like the current situation.
The CWI is not a magic signal for predicting market crashes but rather a tool to inform traders about the underlying risk environment. By incorporating the CWI into a structured trading process, traders can reduce blind spots related to market sentiment and internal market health.
2. How It Works – Mechanics & Data
The Crash Warning Index is constructed by combining various market risk indicators. These include:
- Breadth metrics: These assess how many stocks are participating in a market move. For example, the percentage of stocks above their 50-day moving average (% Above 50-DMA) provides insight into trend health.
- Volatility measures: Average True Range (ATR%) is used to gauge the market's volatility relative to price.
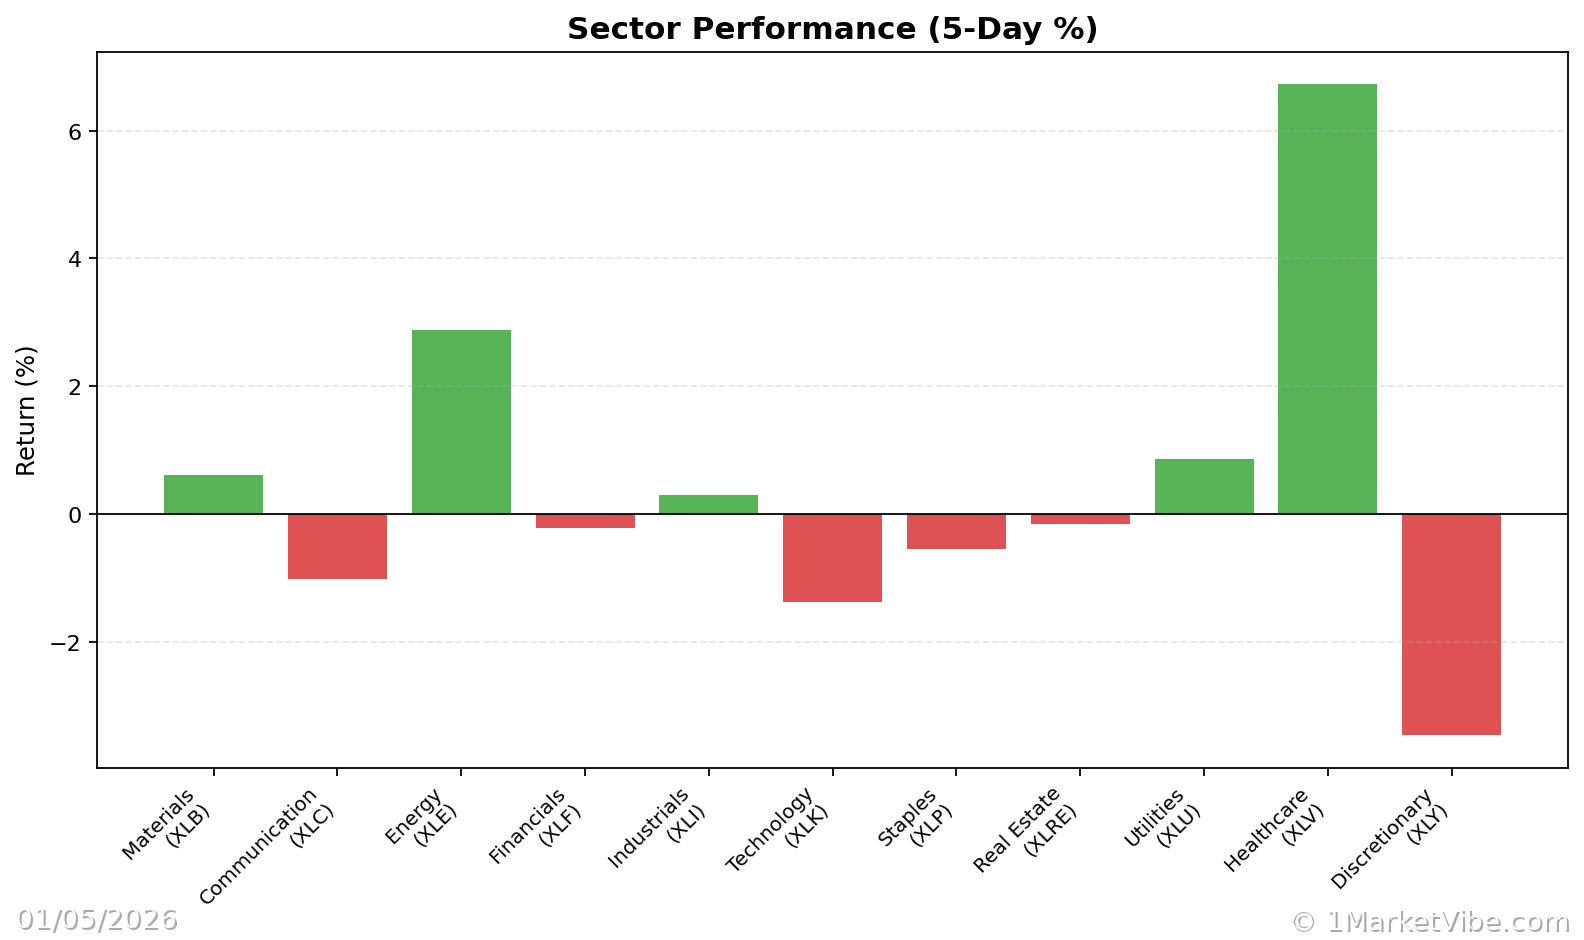
- Defensive behavior: This looks at how defensive sectors (e.g., utilities, consumer staples) are performing relative to the broader market.
The CWI moves based on changes in these underlying components. For instance, a sharp increase in volatility or a decline in breadth can push the CWI higher, indicating elevated market risk.
3. Interpretation – What Different Levels Tend to Mean
The CWI is typically interpreted within certain ranges:
- Below 3: Indicates a relatively low-risk environment where market conditions are stable.
- 3 to 6: Suggests increasing caution as risk factors begin to accumulate.
- Above 6: Signals heightened risk, where market corrections are more likely.
When the CWI is at 5.91, as it is currently, it suggests that the market is nearing a high-risk environment. Traders should be vigilant and consider defensive strategies.
Common combinations of market conditions include:
- Strong breadth + low volatility: Generally indicates a healthy, trending market.
- Weak breadth + rising volatility: Often a precursor to market corrections.
- Defensive sectors leading: Suggests a shift towards risk aversion.
4. Real-World Scenarios – How This Shows Up in Markets
Scenario 1: Topping Environment
Imagine a scenario where major indices are grinding higher, but the % Above 50-DMA is declining. This suggests fewer stocks are participating in the rally, a classic topping pattern. The CWI would likely rise as breadth weakens, warning traders of potential corrections.
Scenario 2: New Bull Leg
In a strong bull market, the % Above 50-DMA surges and remains elevated, indicating robust participation. The CWI would be low, reflecting reduced risk, allowing traders to confidently add exposure.
Scenario 3: Volatility Spike
During geopolitical tensions, like the current situation, ATR% might jump, reflecting increased volatility. The CWI would rise sharply, signaling traders to reassess their risk exposure and possibly hedge positions.
5. How to Use This Insight in a Process
To effectively use the CWI in a trading process:
- Emphasize Defense: When the CWI is high, focus on reducing new risk and protecting existing positions.
- Broaden Exposure: When breadth and leadership are strong, consider increasing exposure, but only if setups align with your strategy.
- Use Market Dashboard: Leverage the Decision Edge dashboard to get a high-level view of market regimes and confirm insights with internal metrics.
6. Common Misuses & Misconceptions
Traders often misuse the CWI by:
- Treating it as a stand-alone entry signal: The CWI should guide risk posture, not dictate specific trades.
- Ignoring context: Always consider sector rotation and broader market conditions.
- Overreacting to one-day changes: Focus on trends rather than daily fluctuations.
A healthier approach is to use the CWI as part of a broader analysis, integrating it with other MarketVibe metrics and dashboards.
To see these breadth and risk metrics in one place each day, you can use the Decision Edge dashboard at 1marketvibe.com.
Disclaimer: This article is for informational purposes only and does not constitute financial advice. Always conduct your own research or consult a financial advisor before making investment decisions.