
CW Index at 6.5 and the Impact of Fed Rate Expectations on Markets
- Authors

- Name
- MarketVibe Team
- @1marketvibe
CW Index at 6.5 and the Impact of Fed Rate Expectations on Markets
1. Orientation – What Are We Explaining?
In this article, we delve into the Crash Warning Index (CWI), currently reading at 6.5, and explore how expectations around Federal Reserve rate decisions can impact market dynamics. The CWI is a composite indicator designed to signal elevated risks of market corrections by synthesizing various market dimensions such as breadth, volatility, and defensive behavior. Understanding this index is crucial for traders as it informs risk management decisions, helps identify potential blind spots, and integrates into a structured trading process rather than serving as a standalone signal.
2. How It Works – Mechanics & Data
The Crash Warning Index is constructed by combining several market risk dimensions:
- Breadth: Measures the percentage of stocks trading above their 50-day moving average, indicating the overall health of the market trend.
- Volatility: Assessed through metrics like ATR% (Average True Range as a percentage of price), which captures the market's price fluctuations.
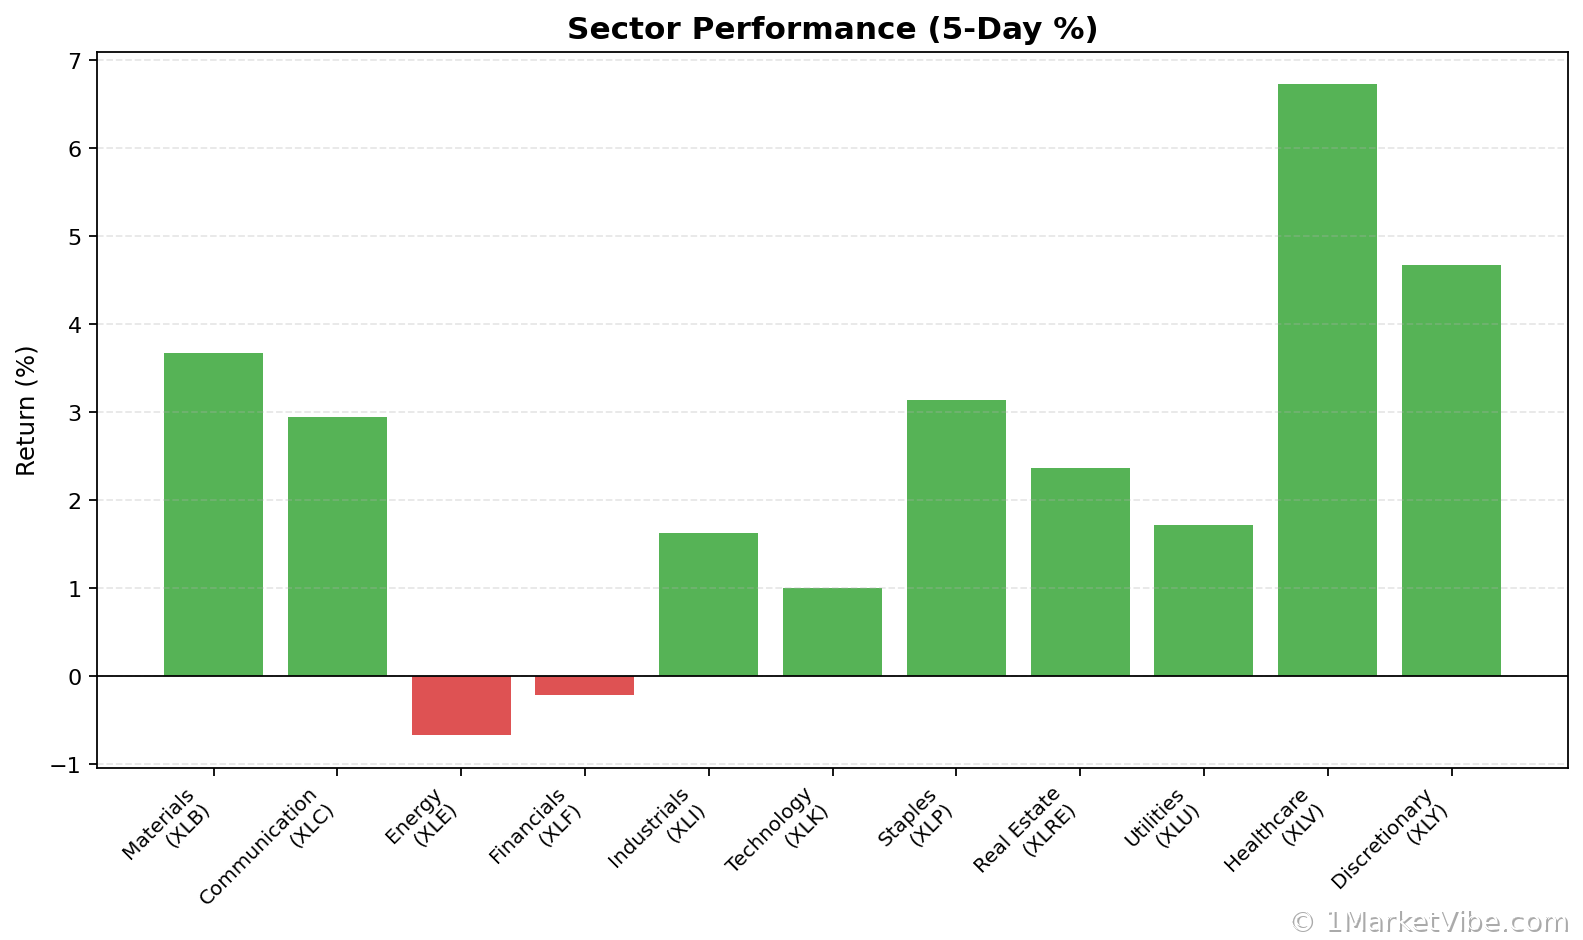
- Defensive Behavior: Evaluates the performance of defensive sectors relative to the broader market, signaling shifts in investor sentiment towards safety.
The CWI moves based on changes in these underlying components. For instance, a decline in breadth with increasing volatility and a shift towards defensive sectors can push the index higher, indicating rising market risks.
3. Interpretation – What Different Levels Tend to Mean
CWI Ranges and Implications:
- Below 3: Low risk, suggesting stable market conditions with minimal correction likelihood.
- 3 to 6: Moderate risk, where caution is advised as market conditions may start to deteriorate.
- Above 6: High risk, indicating elevated chances of market corrections or increased volatility.
When the CWI remains above 6 for several days, as it currently does at 6.5, it suggests heightened market risk, often coinciding with external factors such as economic policy changes or geopolitical tensions.
4. Real-World Scenarios – How This Shows Up in Markets
Scenario 1: Topping Environment
Imagine a scenario where major indices continue to climb, but the percentage of stocks above their 50-DMA declines. This divergence often precedes market tops. Here, the CWI would likely rise as breadth weakens and volatility begins to creep up, signaling traders to be cautious despite apparent index strength.
Scenario 2: Bull Market Resurgence
Conversely, during a strong bull leg, the % Above 50-DMA might surge, reflecting broad participation in the rally. In this case, the CWI would likely decrease, indicating lower risk and supporting increased exposure to equities.
Scenario 3: Volatility Spike
Consider a sudden geopolitical event causing market jitters. The ATR% would spike, increasing the CWI. Traders might feel tempted to panic sell, but a more informed approach would involve evaluating the persistence of volatility and breadth deterioration before making drastic portfolio changes.
5. How to Use This Insight in a Process
- Risk Management: When the CWI is high, like now, focus on defensive strategies. This might include reducing position sizes, increasing cash allocations, or employing hedging strategies.
- Exposure Adjustment: If breadth and leadership broaden, consider increasing exposure, but ensure your setups align with broader market conditions.
- Dashboard Utilization: Use the Market Dashboard to assess the overall market regime and confirm signals from the CWI and other indicators.
6. Common Misuses & Misconceptions
Stand-Alone Signal: Avoid using the CWI as a sole entry or exit signal. It should complement a broader analysis framework.
Ignoring Context: Consider sector rotation and macroeconomic factors. A high CWI in a strong economic environment might not warrant the same caution as in a fragile one.
- Overreacting to Daily Changes: Focus on trends rather than daily fluctuations. A single-day spike in the CWI doesn't necessarily indicate a long-term shift.
To see these breadth and risk metrics in one place each day, you can use the Decision Edge dashboard at 1marketvibe.com.
Disclaimer: This article is for informational purposes only and does not constitute financial advice. Please consult a financial advisor before making any investment decisions.