
Asian Equities Surge and Implications of the CW Index for Investors
- Authors

- Name
- MarketVibe Team
- @1marketvibe
Asian Equities Surge and Implications of the CW Index for Investors
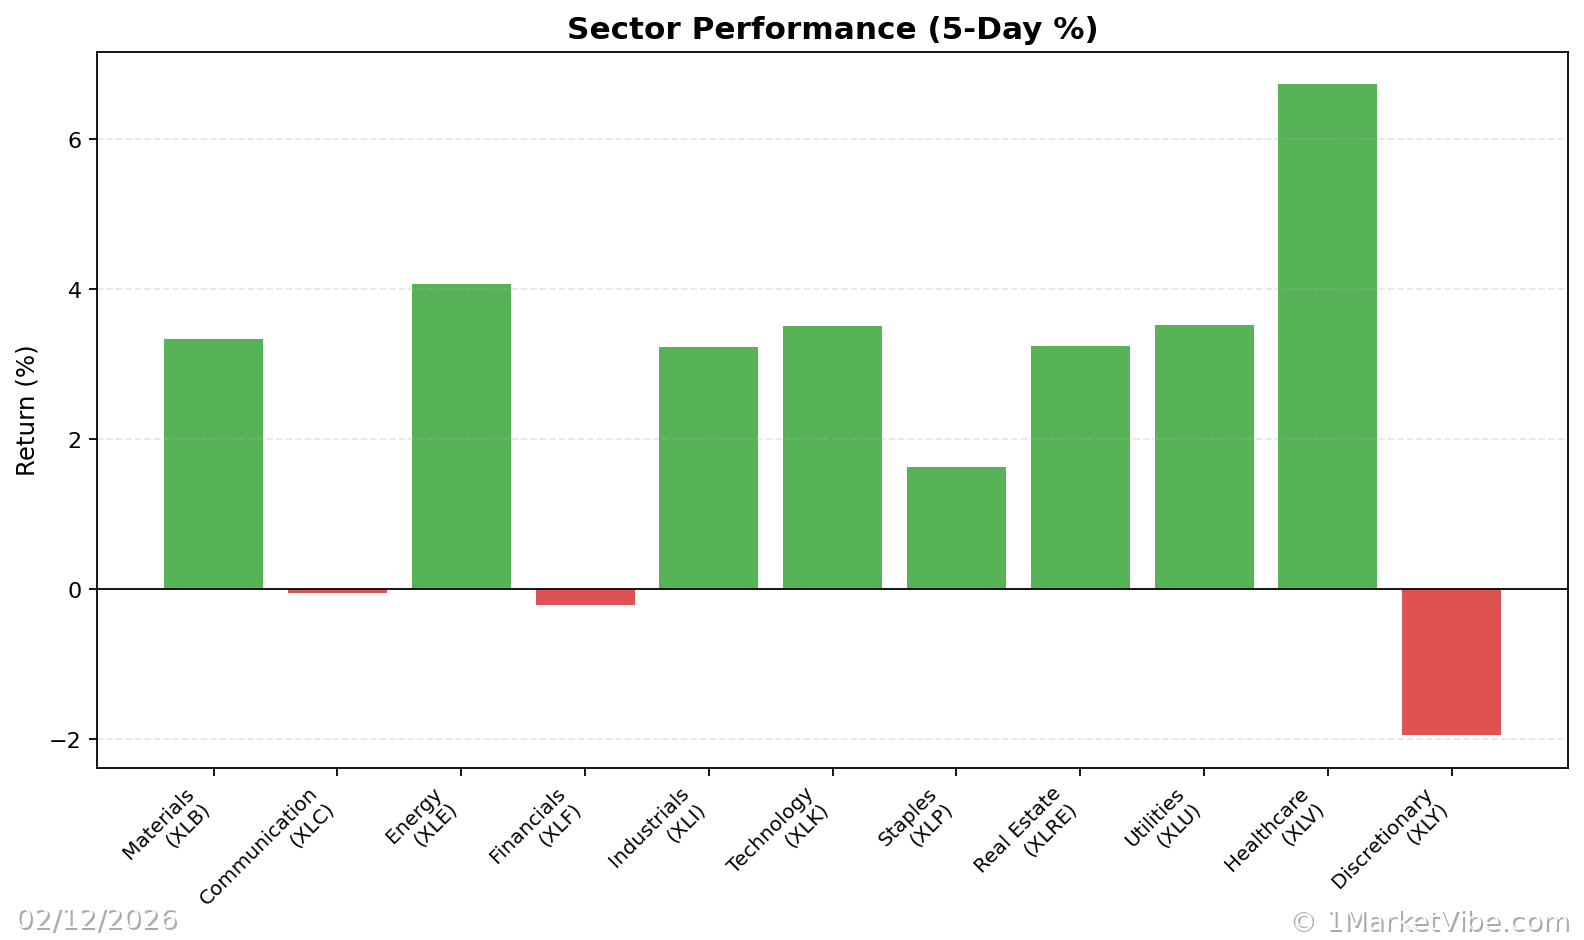
In recent weeks, Asian equities have experienced a notable surge, contrasting with the more subdued performance of U.S. stocks. This divergence highlights the importance of understanding global market dynamics and the tools available to investors for navigating these shifts. One such tool is the Crash Warning Index (CWI), a composite metric that offers insights into market risk conditions. In this article, we will explore the mechanics of the CWI, its current reading, and how it can inform investment strategies in the context of the recent rally in Asian markets.
Understanding the Crash Warning Index (CWI)
Why Traders Should Care
The Crash Warning Index (CWI) is a critical tool for investors seeking to understand market risk levels. It helps inform decisions about risk exposure and portfolio adjustments by providing early warnings of potential market corrections. By incorporating the CWI into a structured investment process, traders can reduce blind spots related to market volatility and breadth, thus enhancing their risk management strategies.
How the CWI Works
The CWI is a composite index that integrates several dimensions of market risk, including:
- Breadth: Measures the percentage of stocks above their 50-day moving average, indicating the overall health of market trends.
- Volatility: Assessed through metrics like the Average True Range (ATR%), which measures price volatility relative to the stock's price.
- Defensive Behavior: Observes shifts towards defensive sectors, which often precede market downturns.
The CWI is constructed by aggregating these components to provide a holistic view of market risk. Daily movements in the CWI are influenced by changes in these underlying factors, such as a sudden increase in volatility or a decline in market breadth.
Interpretation of CWI Levels
The CWI is typically interpreted as follows:
- Below 3: Indicates low risk, suggesting stable market conditions.
- Between 3 and 6: Signals moderate risk, where caution is advised, but no immediate action may be necessary.
- Above 6: Denotes high risk, where the likelihood of a market correction increases significantly.
When the CWI remains above 6 for several days, it often precedes a market correction, prompting investors to consider defensive strategies.
Real-World Scenarios
Scenario 1: Topping Environment
Imagine a scenario where the broader market index continues to rise, but the percentage of stocks above their 50-DMA begins to decline. Here, the CWI might rise above 6, indicating elevated risk. Traders might feel tempted to chase the rising index, but a more informed approach would involve reducing exposure and preparing for a potential downturn.
Scenario 2: Bull Market Leg
In a strong bull market leg, the % Above 50-DMA surges and remains elevated, while the CWI stays below 3. This environment supports increased risk-taking, provided that individual setups align with the broader market trend.
Scenario 3: Volatility Spike
During a market sell-off, ATR% might spike, and the CWI could quickly rise above 6. Traders might panic and sell indiscriminately, but a more strategic response would involve reassessing risk exposure and considering hedging strategies.
How to Use CWI Insights in a Process
To effectively incorporate CWI insights into your investment process, consider the following guidelines:
- High CWI Levels: When the CWI is high, focus on defensive strategies, such as reducing new risk and considering hedges.
- Broadening Breadth and Leadership: If breadth and leadership improve, be open to adding exposure, but ensure that individual setups are robust.
- Use Market Dashboard: Leverage the Market Dashboard to get a high-level view of market regimes and confirm with internal metrics like the CWI.
Common Misuses and Misconceptions
Traders often misuse the CWI in the following ways:
- Stand-Alone Signal: Treating the CWI as a stand-alone entry signal can lead to poor timing decisions. Instead, use it as part of a broader risk assessment framework.
- Ignoring Context: Failing to consider sector rotation or time frames can lead to misinterpretation. Always contextualize CWI readings within the broader market environment.
- Overreacting to Daily Changes: Reacting to one-day changes in the CWI can result in unnecessary trading. Focus on sustained trends and confirmations.
To see these breadth and risk metrics in one place each day, you can use the Decision Edge dashboard at 1marketvibe.com.
DISCLAIMER: This article is for informational purposes only and does not constitute financial advice. Always consult with a financial advisor before making investment decisions.