

Alibaba's $10 Billion Investment in AI Signals a Market Shift
- Authors

- Name
- MarketVibe Team
- @1marketvibe
Alibaba's $10 Billion Investment in AI Signals a Market Shift
In August 2026, Alibaba announced a significant investment in artificial intelligence (AI), marking a strategic pivot that could influence global tech investments. This move, involving a $10.2 billion share placement, has already triggered notable market reactions, including a 10% drop in Alibaba's share price. Understanding the implications of such a strategic shift requires a deep dive into market dynamics, using tools like MarketVibe's Crash Warning Index (CWI) and other metrics to assess risk and opportunity.
Market Context and Alibaba's AI Strategy
Current Market Environment
Global markets are currently navigating a complex landscape characterized by rising bond yields and potential trade tensions, particularly between the U.S. and Canada. These factors contribute to heightened market volatility and uncertainty, making it crucial for traders to rely on robust metrics to guide their decisions.
Alibaba's AI Investment
Alibaba's $10 billion investment in AI is part of a broader strategy to enhance its technological capabilities and compete with other tech giants. This move aligns with a global trend where major companies are doubling down on AI to drive future growth. However, such significant capital allocation can also introduce volatility, as seen in the immediate market reaction.
Understanding MarketVibe's Metrics
Crash Warning Index (CWI)
What is CWI? The Crash Warning Index is a composite metric that assesses market risk by integrating several dimensions, including breadth, volatility, and defensive behavior. A CWI reading above 6 indicates elevated risk, suggesting that corrections are more likely.
Why Traders Should Care: CWI helps traders identify periods of heightened risk, allowing them to adjust their strategies accordingly. It reduces blind spots by providing an early warning system for potential market downturns.
How CWI Works
CWI is constructed by analyzing various market indicators:
- Breadth: Measures the number of stocks advancing versus declining.
- Volatility: Assessed through metrics like ATR% (Average True Range as a percentage of price), indicating market stability.
- Defensive Behavior: Observes shifts into defensive sectors, which often precede market corrections.
Interpretation of CWI Levels
- Below 3: Generally indicates a stable market environment with lower risk.
- Between 3 and 6: Suggests caution, as risk factors are increasing.
- Above 6: Signals high risk, where traders should consider defensive strategies.
Current CWI Reading
The current CWI reading is 5.4, which falls in the cautionary range. This aligns with the market's reaction to Alibaba's announcement, suggesting that traders should be vigilant and possibly reduce exposure to high-risk positions.
Real-World Scenarios
Scenario 1: Topping Environment
Imagine a scenario where the market index continues to rise, but the breadth deteriorates. This could mean fewer stocks are participating in the rally, a classic sign of a topping environment. In such cases, CWI might rise as defensive sectors gain traction, indicating a potential correction.
Scenario 2: Bullish Surge
In a strong bull market, the % Above 50-DMA might surge, indicating robust breadth. If CWI remains low, it suggests a healthy market environment where traders can consider increasing exposure.
Scenario 3: Volatility Spike
A sudden increase in ATR% could signal a volatility spike, often accompanied by a rising CWI. This scenario requires traders to reassess their risk exposure and possibly hedge against potential downturns.
Incorporating Insights into Your Trading Process
Practical Guidelines
- Defensive Posture: When CWI is high, emphasize defense by reducing new risk and focusing on capital preservation.
- Breadth and Leadership: When market breadth and leadership broaden, consider adding exposure, provided your setups align with your strategy.
- Use Market Dashboard: Leverage the Market Dashboard as a high-level regime label, confirming with internal metrics like CWI for a comprehensive view.
Common Misuses and Misconceptions
- Standalone Signal Misuse: Traders often misuse CWI as a standalone entry signal. Instead, use it as a guide for risk posture.
- Ignoring Context: Failing to consider sector rotation and broader market context can lead to misinterpretation. Always analyze metrics within the full market picture.
- Overreacting to Daily Changes: One-day metric changes can be misleading. Focus on trends and sustained levels for more reliable insights.
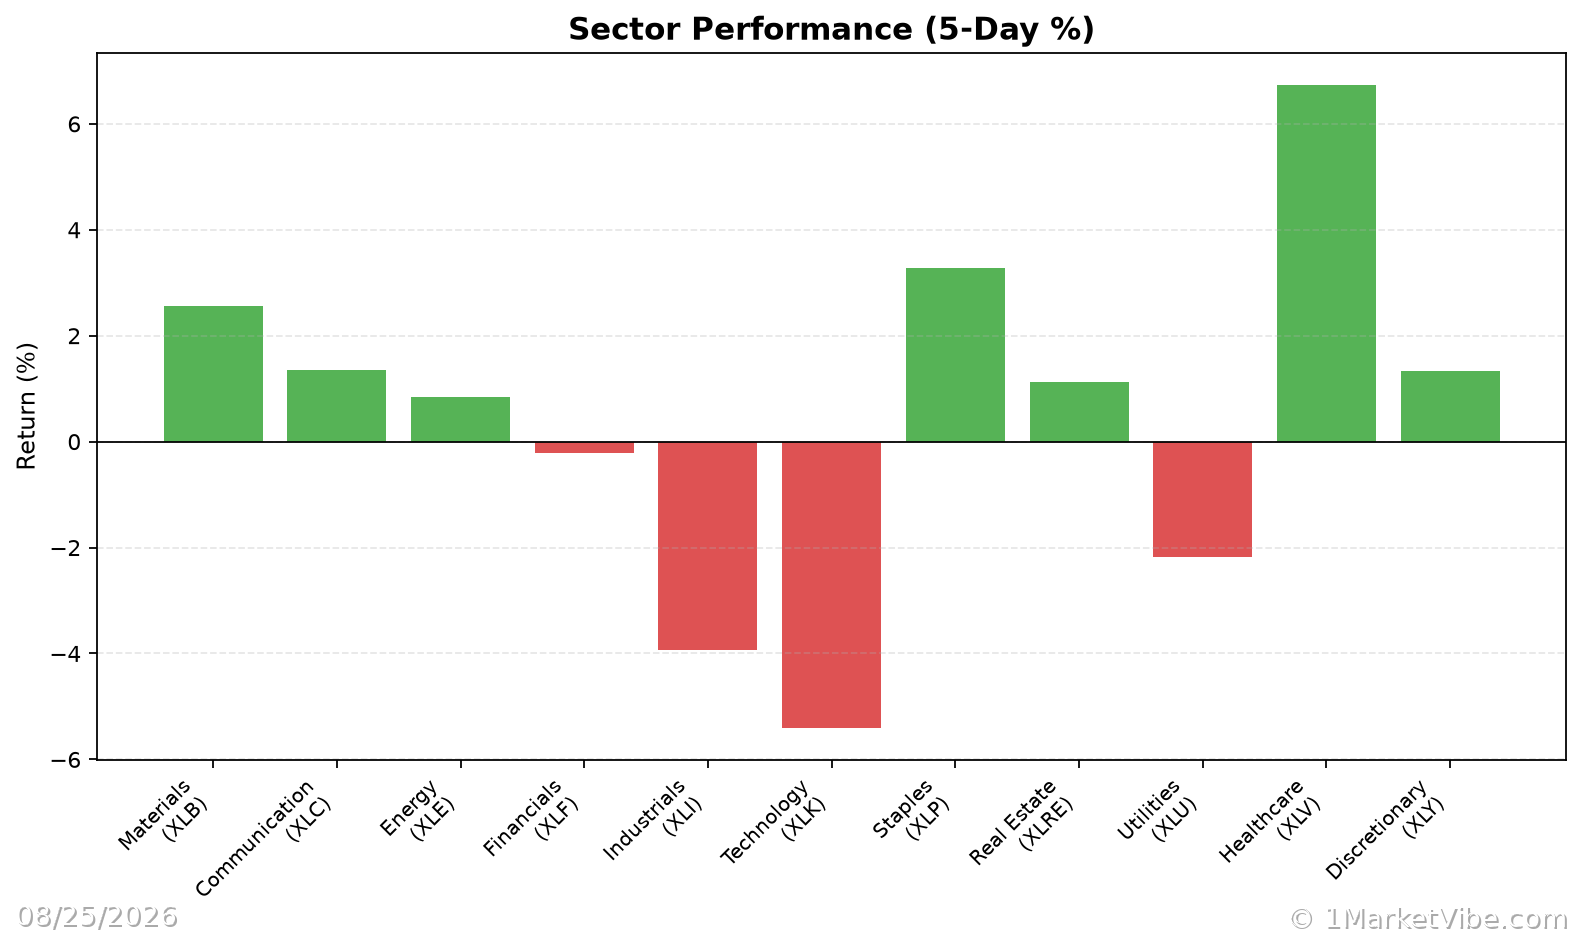
To see these breadth and risk metrics in one place each day, you can use the Decision Edge dashboard at 1marketvibe.com.
Disclaimer: The information provided is for educational purposes only and should not be considered as investment advice. Always conduct your own research before making any investment decisions.