Trump's $220 Million Trading Spree Raises Concerns on Wall Street
- Authors

- Name
- MarketVibe Team
- @1marketvibe
Trump's $220 Million Trading Spree Raises Concerns on Wall Street
In a surprising turn of events, former President Donald Trump has engaged in a significant trading spree, amassing $220 million in financial transactions within the first quarter of 2026. This activity has sparked considerable concern on Wall Street, raising questions about potential conflicts of interest and market stability. As investors seek clarity, MarketVibe's proprietary Enhanced CW Index provides a crucial tool for navigating these uncertain waters. The Enhanced CW Index, a 0-10 scale designed to offer a 4-6 week early warning of market corrections by tracking institutional gold flows and market breadth, is currently at 5.7. This level remains below the 7.0 warning threshold, indicating moderate risk.
Market Reaction
The immediate impact of Trump's trading activities has been palpable across the stock market. Major indices experienced heightened volatility as investors grappled with the implications of such significant trades by a public figure. The CW Index at 5.7 suggests that while the market is not yet at a critical risk level, the situation warrants close monitoring. Historically, when the CW Index hit 7.1 in March 2023, markets fell 8.3% over the following month, underscoring the importance of this metric as an early warning system.
Learn more about how CW Index works at 1marketvibe.com
Conflict of Interest
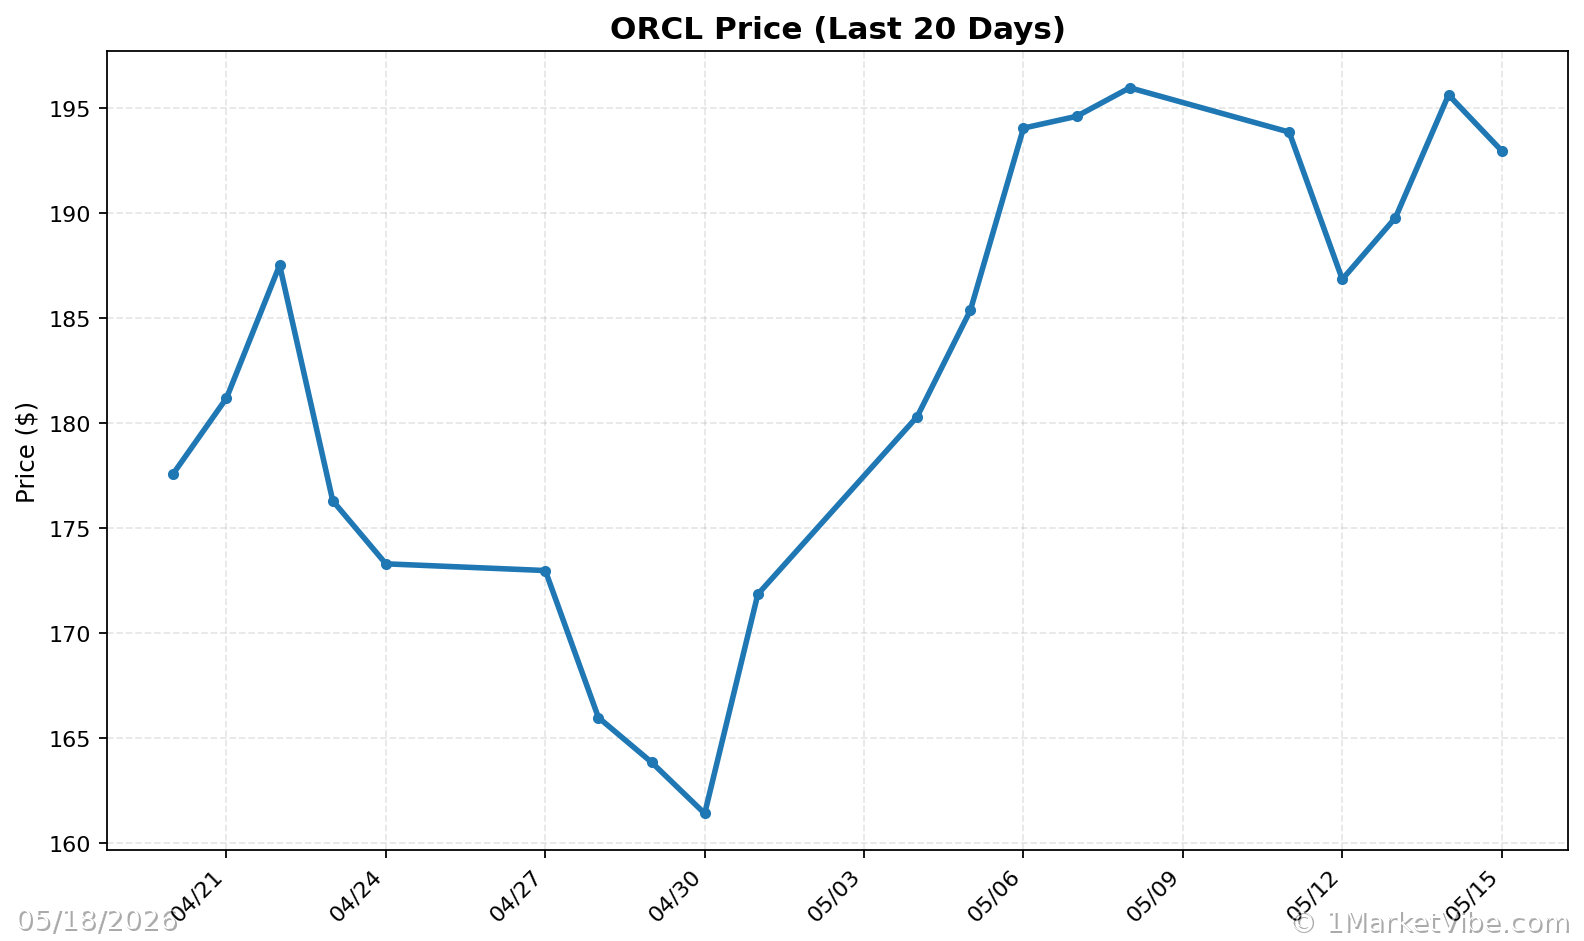
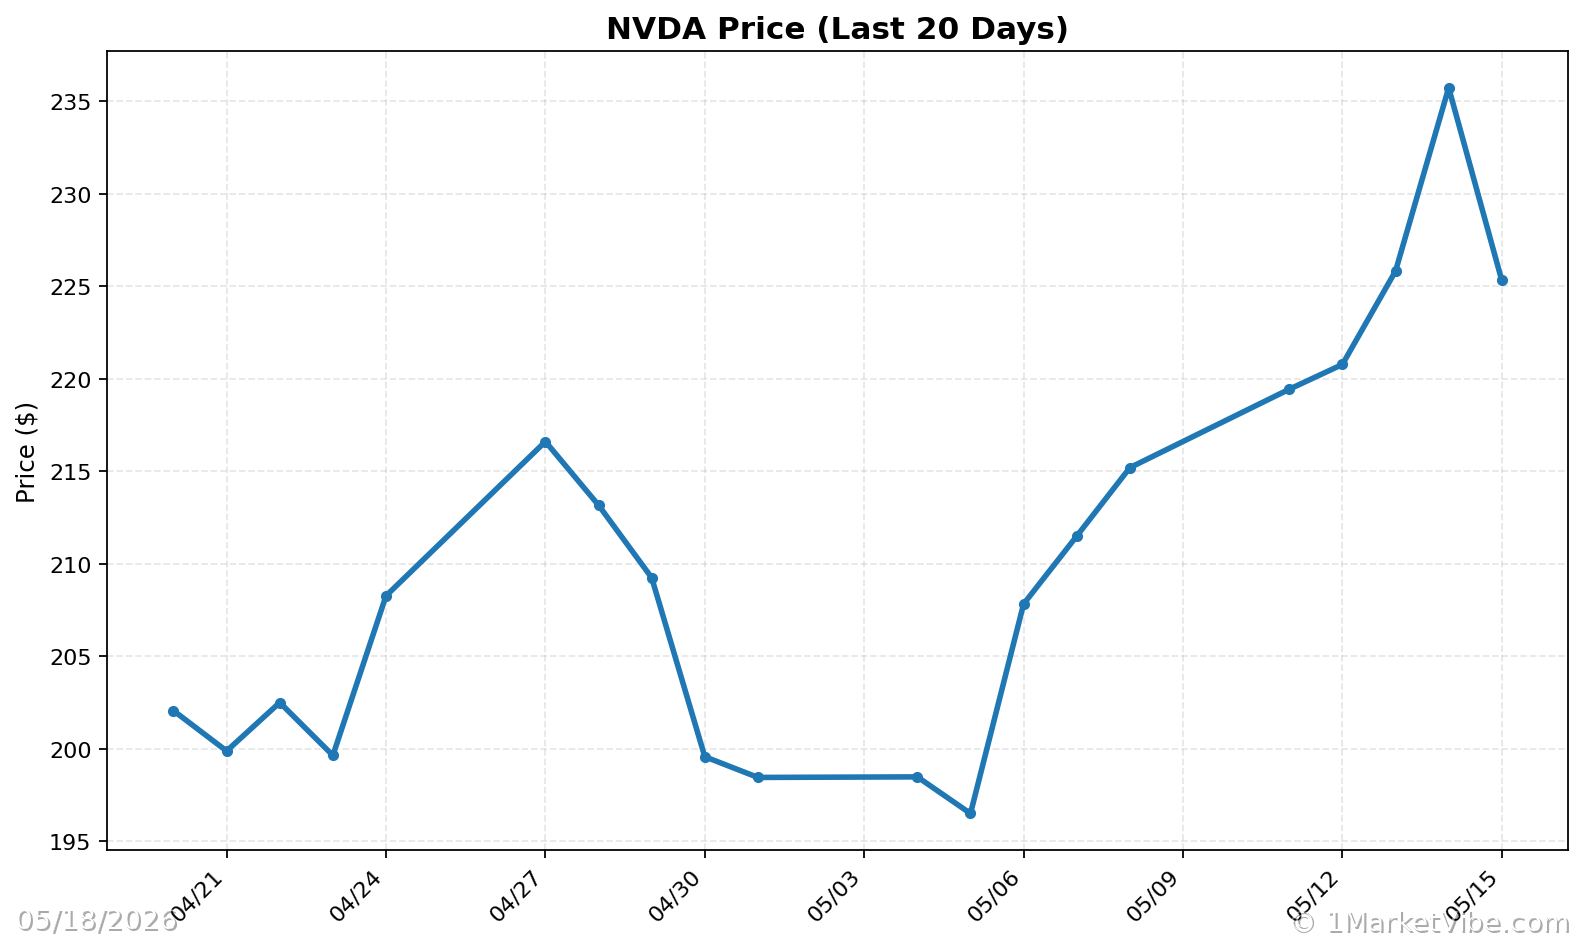
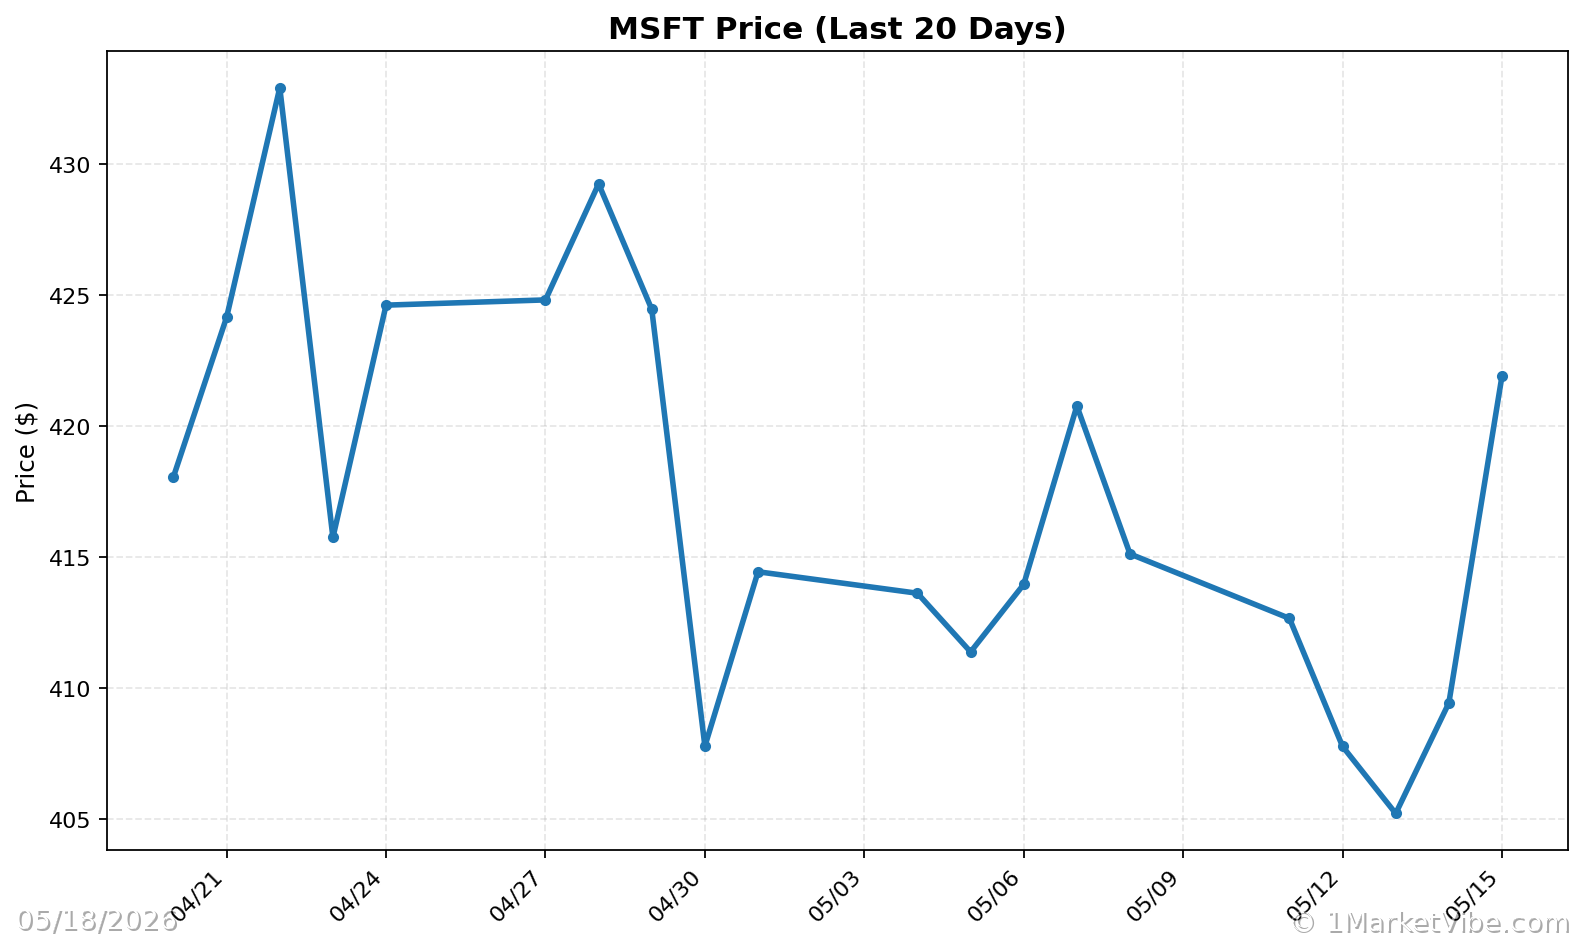
Trump's trading activities have raised ethical concerns, particularly given his previous role as President and his ongoing influence in political circles. The trades involve companies like Nvidia, Oracle, and Microsoft, which have direct ties to his administration. This situation echoes past controversies where political figures faced scrutiny for trading activities that appeared to leverage insider knowledge. MarketVibe's CW Index, with its gold component providing a 4-6 week advance notice, is an invaluable tool for investors navigating these complex scenarios.
Influence on Market Trends
The potential influence of Trump's trades on market trends cannot be understated. His actions could shape investment strategies, particularly in sectors where he has significant holdings. Historically, political figures have impacted market dynamics, and Trump's activities may set a precedent for future market behavior. According to MarketVibe data, the current CW Index reading suggests that while the market is not in immediate danger, investors should remain vigilant.
Regulatory Concerns
The regulatory framework surrounding trading by public figures is under scrutiny as Trump's activities come to light. Existing regulations aim to prevent conflicts of interest, yet the frequency and scale of these trades have prompted calls for increased transparency and oversight. MarketVibe's proprietary system, built by investors for investors, emphasizes the importance of early warning and actionable insights in such regulatory environments.
Expert Opinions
Financial analysts are divided on the implications of Trump's trading spree. Some view it as a potential destabilizing factor, while others see it as a strategic move that could influence market trends. MarketVibe's Enhanced CW Index provides a balanced perspective, offering investors a reliable gauge of market conditions. As the CW Index suggests moderate risk, experts recommend monitoring key metrics closely.
Broader Economic Implications
The broader economic implications of Trump's trading activities extend beyond immediate market reactions. Long-term effects on market confidence and investor behavior are possible, particularly if similar activities by public figures become more common. MarketVibe tracks these developments, providing investors with the insights needed to make informed decisions.
MarketVibe Decision Edge™: Your Action Plan
MarketVibe's Decision Edge™ Method simplifies complex market signals into three clear steps: Glance → Learn → Act. This proprietary framework turns market intelligence into actionable decisions, empowering investors to navigate the current landscape effectively.
🔍 Glance (10-Second Takeaway)
- Current CW Index reading: 5.7, indicating moderate risk.
- Overall market status: Yellow flag.
- Key metric to watch: Institutional gold flows.
📚 Learn (2-Minute Deep Dive)
Trump's $220 million trading spree has introduced new variables into the market equation. Historically, political figures have had a profound impact on market dynamics, and Trump's actions are no exception. The Enhanced CW Index, with its early warning capabilities, remains a critical tool for investors seeking to understand potential market corrections. As the market processes these developments, it is essential to monitor the CW Index closely. If the index approaches or surpasses the 6.5 threshold, it may signal increased risk, warranting strategic adjustments.
⚡ Act (Specific Steps)
For Conservative Investors:
- Maintain current allocations but monitor the CW Index closely.
- Consider increasing cash reserves if the index trends upward.
For Aggressive Investors:
- Evaluate opportunities in sectors impacted by Trump's trades.
- Implement hedging strategies if the CW Index approaches 6.5.
For Balanced Investors:
- Adjust sector exposure based on CW Index movements.
- Stay informed through MarketVibe's real-time alerts.
Access MarketVibe's full Decision Edge framework at 1marketvibe.com →
Conclusion
Trump's $220 million trading spree has undoubtedly raised concerns on Wall Street, highlighting the need for vigilant market monitoring. MarketVibe's Enhanced CW Index and Decision Edge™ Method offer investors the tools necessary to navigate these complex scenarios with confidence. As the situation evolves, staying informed and proactive will be key to managing risk and seizing opportunities.
Disclaimer: This article is for informational purposes only and does not constitute financial advice. Always consult with a financial advisor before making investment decisions.
Charts