
Stocks Decline as Oil Prices Reach $100: Insights from the CW Index
- Authors

- Name
- MarketVibe Team
- @1marketvibe
Stocks Decline as Oil Prices Reach $100: Insights from the CW Index
Market Overview
The stock market has experienced a notable decline as U.S. oil prices surged past $100 a barrel, marking the fourth consecutive day of losses. This rise in oil prices has sent ripples across various sectors, impacting market sentiment and investor confidence. As the market grapples with these changes, MarketVibe's proprietary Enhanced CW Index provides critical insights. This index, operating on a 0-10 scale, offers a 4-6 week early warning of potential market corrections by analyzing institutional gold flows and market breadth. Currently, the CW Index stands at 6.3, indicating a cautious market environment, yet still below the critical 7.0 warning threshold.
Learn more about how CW Index works at 1marketvibe.com
Impact of Rising Yields
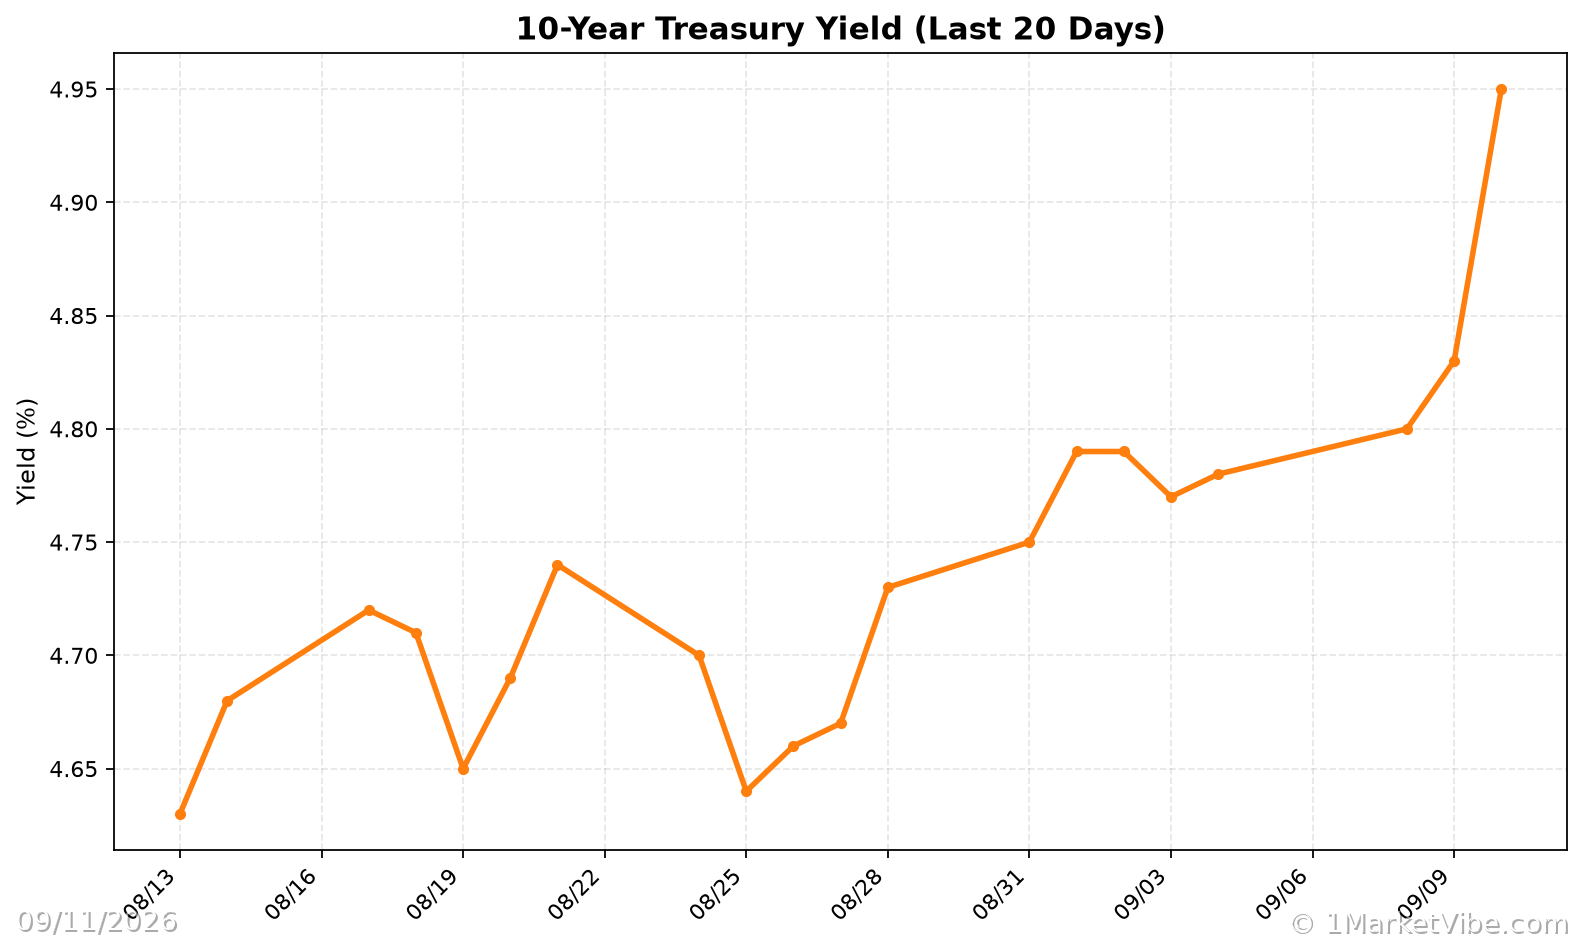
Compounding the effects of rising oil prices, the yield on the 10-year Treasury note has reached its highest level since October, contributing to increased borrowing costs and heightened inflation concerns. Historically, elevated yields have pressured equities, as seen when the CW Index hit 7.1 in March 2023, leading to an 8.3% market decline. The current CW Index reading of 6.3 suggests that while the risk is moderate, investors should remain vigilant.
CW Index Insights
The Enhanced CW Index at 6.3 reflects a market in a state of caution. This level suggests that while immediate panic is unwarranted, the market is not entirely free from risk. The index's unique gold component, which provides a 4-6 week early warning, has been instrumental in forecasting the current market trends. Investors should monitor any upward movement in the CW Index, particularly if it approaches the 6.5 level, which could signal increased volatility.
Sector Reactions
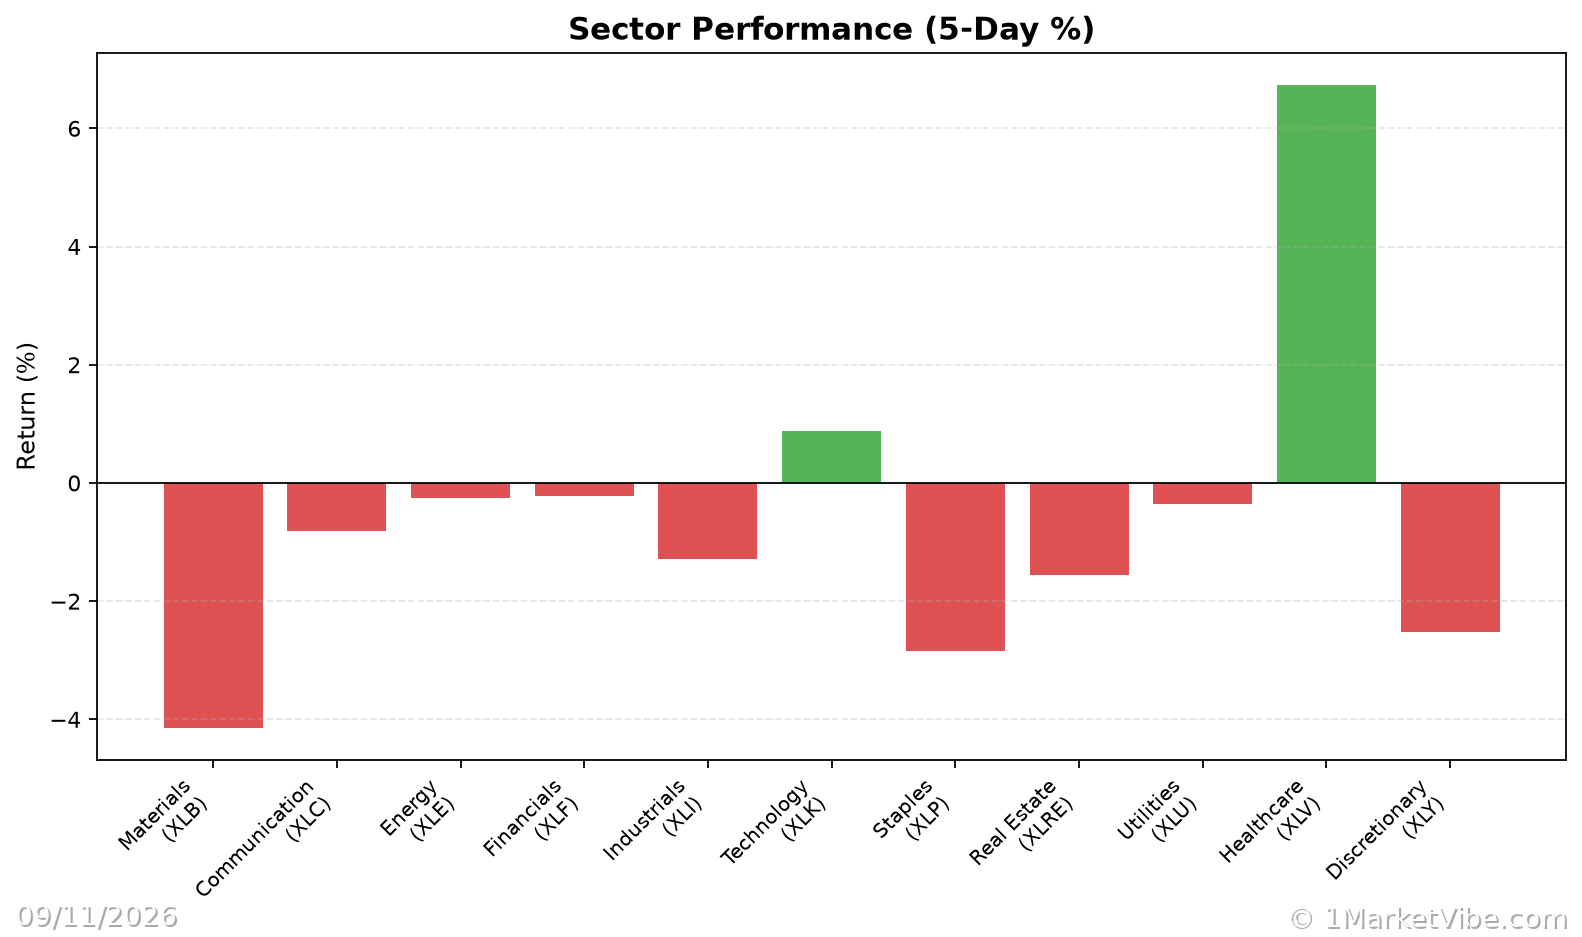
The energy sector has been a rare beneficiary of the rising oil prices, showing resilience amid broader market declines. In contrast, technology stocks have faced significant pressure due to their sensitivity to interest rates and inflation. This sectoral shift underscores the importance of diversification, as investors pivot towards inflation-sensitive sectors like energy and consumer staples.
Investor Sentiment
Despite the volatility, market sentiment remains relatively neutral. Concerns about inflation and economic stability continue to weigh on investors' minds, yet the current CW Index reading suggests that the market is not on the brink of a severe downturn. Historical patterns indicate that maintaining a balanced portfolio and staying informed through tools like the CW Index can help navigate these uncertain times.
Future Considerations
Looking ahead, the potential for further market fluctuations remains high, especially with upcoming inflation data releases. Investors are advised to keep a close eye on oil prices and yield trends, as these factors will likely influence market dynamics. The CW Index's early warning capability will be crucial in anticipating any significant market shifts.
MarketVibe Decision Edge™: Your Action Plan
MarketVibe's Decision Edge™ Method simplifies complex market signals into three clear steps: Glance → Learn → Act. This proprietary framework turns market intelligence into actionable decisions, empowering investors to navigate the current landscape effectively.
🔍 Glance (10-Second Takeaway)
- Current CW Index Reading: 6.3
- Market Status: Yellow flag, indicating caution
- Key Metric to Watch: Oil prices and Treasury yields
📚 Learn (2-Minute Deep Dive)
The current market conditions, characterized by rising oil prices and elevated yields, have created a challenging environment for investors. Historically, such scenarios have led to increased market volatility, as seen when the CW Index previously indicated heightened risk levels. The current reading of 6.3, while not alarming, suggests that investors should remain cautious and informed.
The interplay between oil prices and stock performance is a critical factor to monitor. As oil prices influence inflation expectations, they also impact interest rates and, consequently, the broader market. The CW Index's early warning system, particularly its gold flow component, has been instrumental in forecasting these trends, providing investors with a strategic advantage.
⚡ Act (Specific Steps)
- Reassess Portfolio Allocation: Consider increasing exposure to energy and consumer staples sectors, which benefit from rising oil prices.
- Monitor CW Index Movements: If the index approaches 6.5, consider adjusting risk exposure and implementing hedging strategies.
- Stay Informed: Utilize MarketVibe's tools to track real-time market signals and adjust strategies accordingly.
Access MarketVibe's full Decision Edge framework at 1marketvibe.com →
Conclusion
The current market conditions highlight the interconnectedness of oil prices, yields, and stock performance. As investors navigate this complex landscape, tools like MarketVibe's Enhanced CW Index and Decision Edge™ Method provide invaluable insights and actionable strategies. By leveraging these resources, investors can make informed decisions and manage risk effectively.
Disclaimer: This article is for informational purposes only and does not constitute financial advice. Always consult with a financial advisor before making investment decisions.