
Oil Executives Warn of Potential Global Supply Chain Disruptions from Iran Conflict
- Authors

- Name
- MarketVibe Team
- @1marketvibe
Understanding Market Dynamics Amid Geopolitical Tensions: The Iran Conflict and Oil Supply Chain Disruptions
In light of recent geopolitical tensions involving Iran, oil industry executives have raised alarms about potential global supply chain disruptions. This situation underscores the importance of understanding how such events can impact financial markets, particularly through the lens of MarketVibe's metrics. By examining these metrics, traders can gain insights into market dynamics and make informed decisions.
Orientation – What Are We Explaining?
In this article, we focus on the Crash Warning Index (CWI) and its role in assessing market risk during geopolitical tensions. The CWI is a composite indicator that reflects various dimensions of market risk, including breadth, volatility, and defensive behavior. Understanding the CWI can help traders identify potential market corrections and adjust their risk exposure accordingly.
Why Traders Should Care
- Informed Decision-Making: The CWI informs traders about the current risk environment, helping them make more informed decisions regarding their portfolios.
- Blind Spot Reduction: By incorporating multiple risk dimensions, the CWI reduces blind spots that might arise from focusing on a single indicator.
- Structured Process: The CWI is not a magic signal but a tool that fits into a structured trading process, guiding risk management and expectation setting.
How It Works – Mechanics & Data
Constructing the CWI
The Crash Warning Index is constructed by aggregating several market indicators:
- Breadth: Measures the percentage of stocks above their 50-day moving average (% Above 50-DMA), indicating market participation.
- Volatility: Assessed through metrics like ATR% (Average True Range as a percentage of price), which captures market volatility.
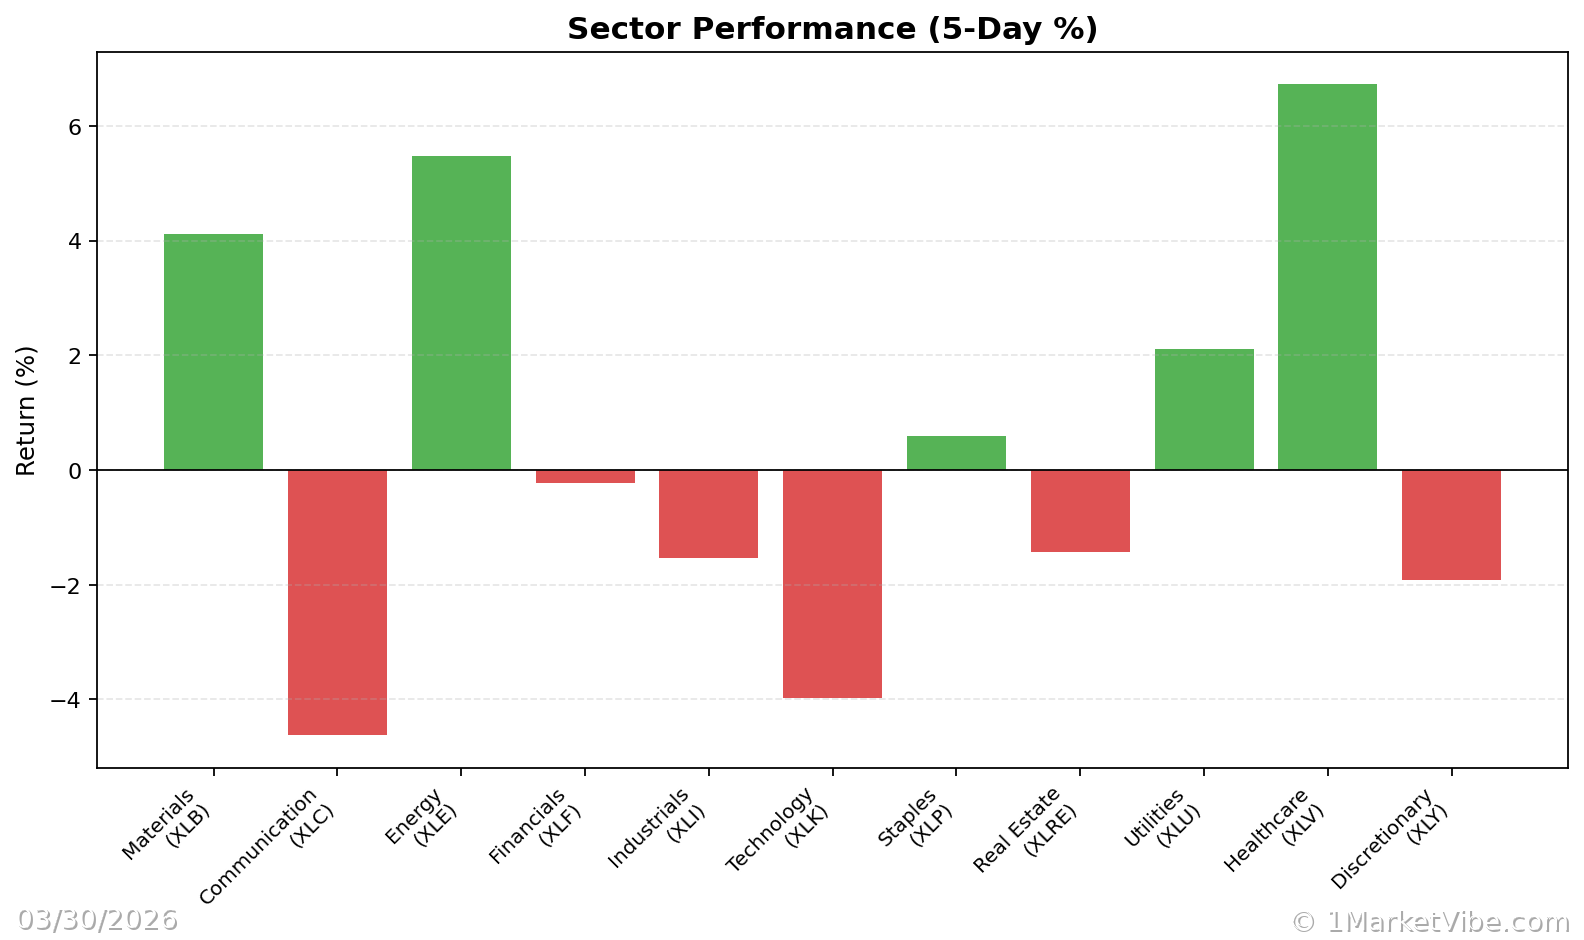
- Defensive Behavior: Observes sector rotation and leadership, particularly shifts towards defensive sectors.
Each component contributes to an overall risk score, with higher values indicating elevated risk conditions.
Daily Movements
The CWI moves based on changes in its underlying components. For example, a sudden increase in market volatility or a decline in breadth can push the CWI higher, signaling increased market risk.
Interpretation – What Different Levels Tend to Mean
CWI Ranges and Implications
- CWI Below 3: Generally indicates a stable market environment with lower risk of corrections.
- CWI Between 3 and 6: Suggests moderate risk, where traders should be cautious but not overly defensive.
- CWI Above 6: Signals elevated risk, where market corrections become more likely, and a defensive posture is advisable.
Common Combinations
- Strong Breadth + Low Volatility: Often seen in stable, trending markets.
- Weak Breadth + Rising Volatility: Indicates potential market instability and heightened risk.
Real-World Scenarios – How This Shows Up in Markets
Scenario 1: Topping Environment
Imagine a scenario where major indices continue to rise, but the % Above 50-DMA begins to decline. This divergence suggests weakening market breadth, often a precursor to a market top. Traders might feel tempted to chase the rally, but a high CWI would advise caution.
Scenario 2: Bull Market Leg
In a strong bull market, the % Above 50-DMA surges and remains elevated, indicating robust market participation. Here, a low CWI supports a more aggressive risk posture, provided individual setups align with the broader trend.
Scenario 3: Volatility Spike
A geopolitical event, such as the Iran conflict, could cause a spike in ATR%, reflecting increased market volatility. If the CWI also rises sharply, it signals traders to reduce exposure and focus on risk management.
How to Use This Insight in a Process
Practical Guidelines
- High CWI: Emphasize defense, reduce new risk, and consider hedging strategies.
- Low CWI with Broad Leadership: Be open to adding exposure if setups are favorable.
- Market Dashboard: Use it as a high-level regime label, then confirm with internal metrics like breadth and volatility.
Common Misuses & Misconceptions
Misuse 1: Stand-Alone Signal
Some traders treat the CWI as a stand-alone entry signal. Instead, it should guide risk posture and be used in conjunction with other indicators.
Misuse 2: Ignoring Context
Ignoring sector rotation and broader market context can lead to misinterpretation. Always consider the CWI within the full market picture.
Misuse 3: Overreacting to One-Day Changes
Reacting to daily fluctuations in the CWI can lead to whipsawing. Focus on sustained trends and significant changes in the index.
To see these breadth and risk metrics in one place each day, you can use the Decision Edge dashboard at 1marketvibe.com.
DISCLAIMER: This article is for informational purposes only and should not be considered financial advice. Always consult with a financial advisor before making investment decisions.