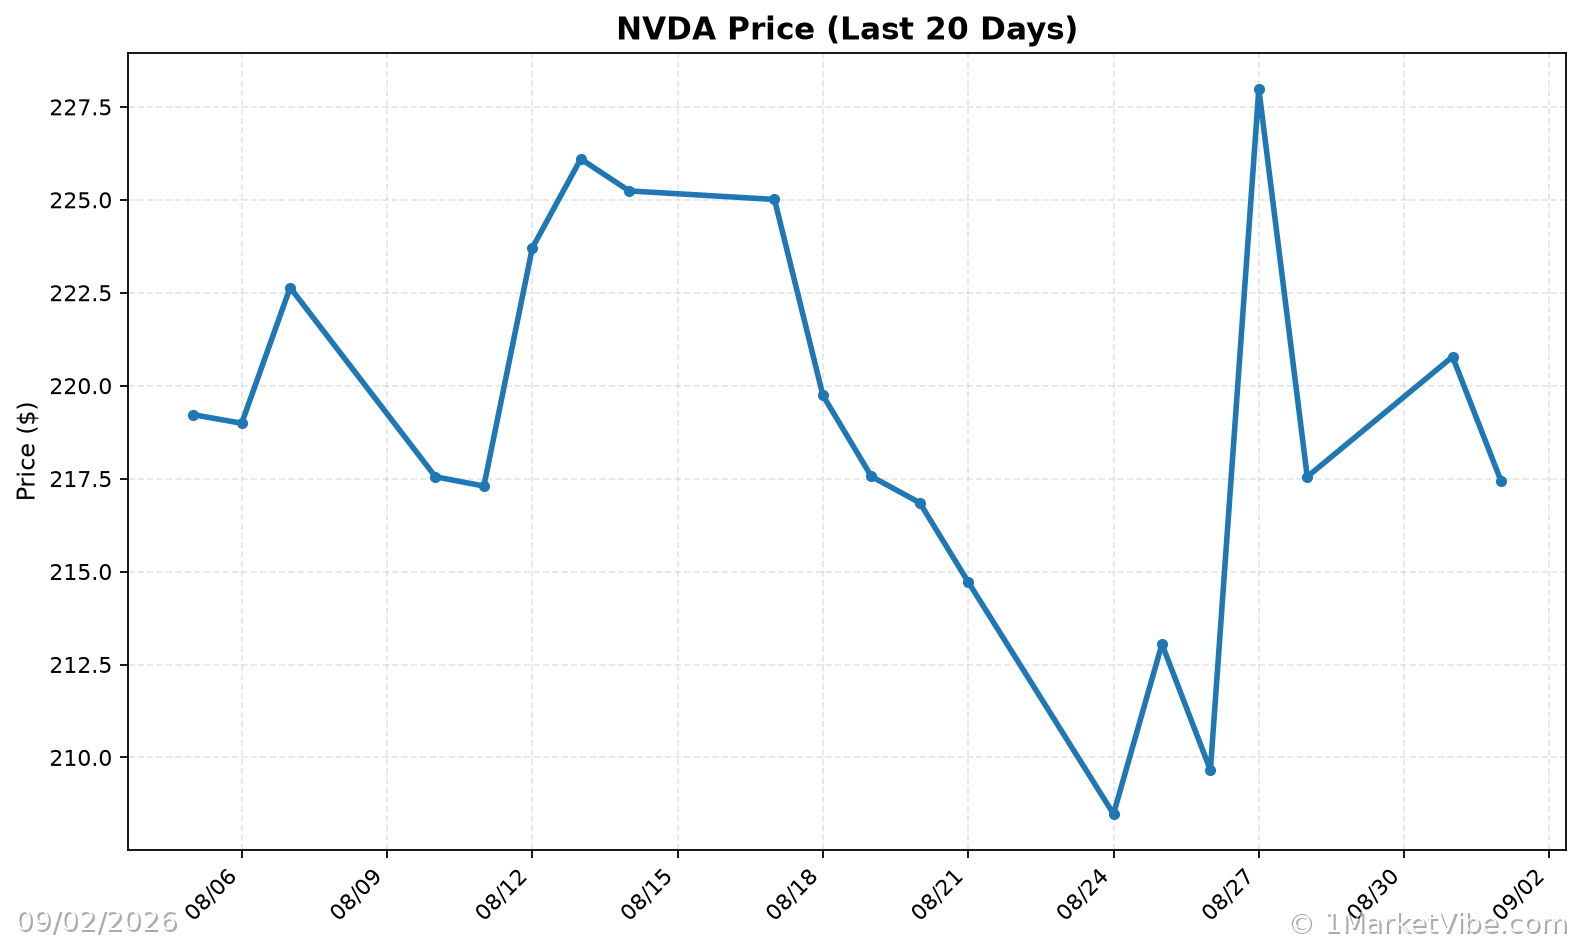
Nvidia Stock Surge: 2027 Price Prediction
Orientation – What Are We Explaining?
In this article, we delve into the factors influencing Nvidia's stock price prediction for 2027. While specific stock predictions can be speculative, understanding the broader market context and key metrics can help traders make more informed decisions. We'll explore how Nvidia's dominance in the AI and data center markets, alongside its financial performance, impacts its stock trajectory. This insight is crucial for traders aiming to navigate the complexities of market dynamics and adjust their strategies accordingly.
How It Works – Mechanics & Data
Nvidia's stock performance is closely tied to its role in the AI and data center sectors. The company's GPUs and its Compute Unified Device Architecture (CUDA) have established a significant competitive edge. Nvidia's financial results, including a 1,490% increase in revenue and a 4,120% jump in net income, underscore its market strength. These metrics are important as they reflect the company's ability to sustain growth and drive stock performance.
To understand Nvidia's stock prediction, we consider several MarketVibe metrics:
- % Above 50-DMA: This breadth indicator measures the percentage of stocks trading above their 50-day moving average, providing insight into market health and trend strength.
- ATR%: Average True Range as a percentage of price, indicating market volatility. High ATR% suggests increased volatility, while low ATR% indicates a more stable market environment.
- CWI (Crash Warning Index): A composite measure of risk, incorporating breadth, volatility, and defensive behavior. A high CWI signals elevated risk and potential corrections.
Interpretation – What Different Levels Tend to Mean
Understanding these metrics helps traders interpret market conditions:
- % Above 50-DMA: When this metric is high, it indicates strong market breadth and a healthy trend. Conversely, a low percentage suggests market weakness or oversold conditions.
- ATR%: Low ATR% often corresponds to quiet, trending phases, while high ATR% indicates choppy or unstable market conditions.
- CWI: A CWI above 6 suggests elevated risk, where corrections are more likely. Traders should be cautious and consider defensive strategies.
Real-World Scenarios – How This Shows Up in Markets
Let's explore a few scenarios to illustrate how these metrics interact:
Strong Bull Market: Nvidia's stock surges as % Above 50-DMA remains high, indicating robust market breadth. ATR% is low, suggesting a stable upward trend. Traders might feel confident, but it's essential to monitor CWI for any signs of increased risk.
Volatility Spike: A sudden increase in ATR% signals heightened market volatility. If CWI also rises, traders should consider reducing exposure and adopting defensive positions. Nvidia's stock may experience short-term fluctuations, but long-term prospects remain strong due to its market position.
Market Correction: A decline in % Above 50-DMA and a high CWI indicate a potential market correction. Traders may be tempted to sell, but a more informed approach involves evaluating Nvidia's fundamental strengths and long-term growth potential.
How to Use This Insight in a Process
To incorporate these insights into a trading process:
- Monitor Breadth and Volatility: Use % Above 50-DMA and ATR% to gauge market conditions. Strong breadth and low volatility suggest favorable conditions for adding exposure, while weak breadth and high volatility warrant caution.
- Assess Risk with CWI: A high CWI signals elevated risk. In such cases, emphasize defensive strategies and reduce new risk.
- Leverage Market Dashboard: Use MarketVibe's Decision Edge dashboard to view these metrics in one place, helping you align your risk posture with current market conditions.
Common Misuses & Misconceptions
Traders often misuse these metrics by:
- Treating Metrics as Stand-Alone Signals: It's crucial to consider the broader market context and not rely solely on one metric for trading decisions.
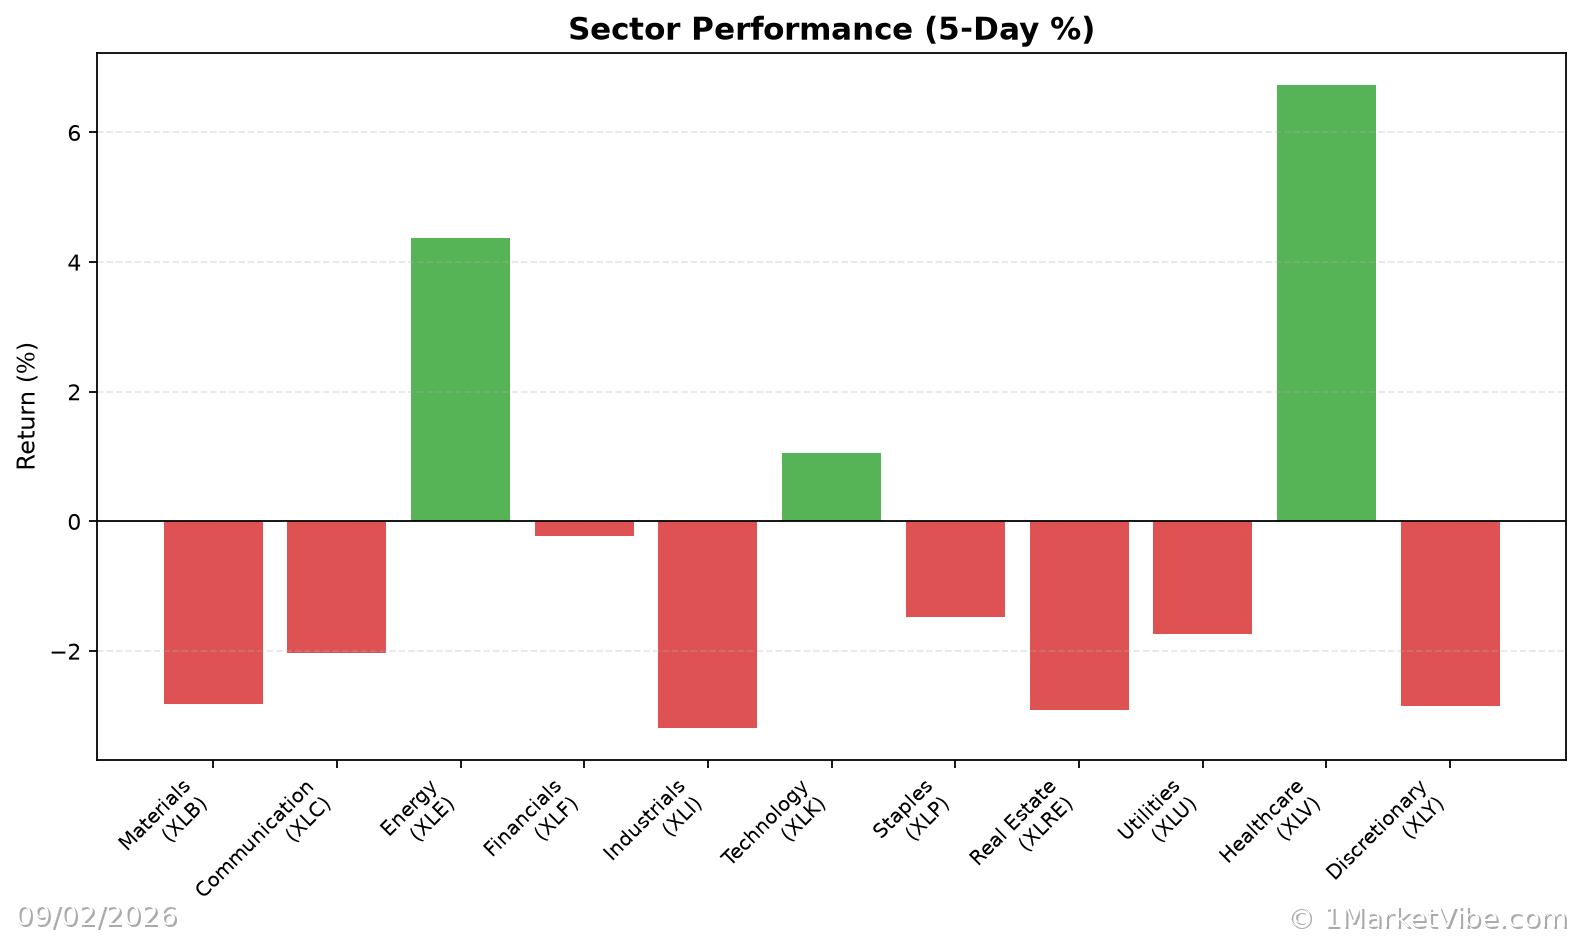
- Ignoring Sector Rotation: Market dynamics can shift, and sector leadership may change. Stay informed about sector performance and adjust strategies accordingly.
- Overreacting to Short-Term Changes: Avoid making impulsive decisions based on daily fluctuations. Focus on long-term trends and fundamental strengths.
To see these breadth and risk metrics in one place each day, you can use the Decision Edge dashboard at 1marketvibe.com.
Disclaimer: This article is for informational purposes only and should not be considered financial advice. Always conduct your own research or consult with a financial advisor before making investment decisions.
Charts