

Impact of Alibaba and BYD's Military Ties on Global Tech Supply Chains
- Authors

- Name
- MarketVibe Team
- @1marketvibe
Impact of Alibaba and BYD's Military Ties on Global Tech Supply Chains
In recent developments, the Pentagon has labeled prominent Chinese companies like Alibaba and BYD as having ties to the Chinese military. This designation has significant implications for global tech supply chains and investor sentiment. Understanding these impacts requires a comprehensive look at the interconnected nature of global markets and the metrics that traders can use to navigate these complexities.
Implications for Global Supply Chains
The inclusion of Alibaba and BYD on the Pentagon's list of Chinese military companies reflects a growing concern about the integration of commercial and military interests in China. This move could lead to increased scrutiny and potential restrictions on these companies, affecting their operations and partnerships globally.
For traders, this development is crucial as it can disrupt supply chains, especially in the tech sector where Alibaba and BYD play significant roles. Alibaba's e-commerce and cloud computing services, along with BYD's advancements in electric vehicles and batteries, are integral to many global supply chains. Disruptions here could lead to delays, increased costs, and shifts in market dynamics.
Investor Sentiment
Investor sentiment is likely to be affected by these developments. The designation of these companies as military-linked could lead to reputational damage and increased regulatory scrutiny, potentially impacting their stock prices and market valuations. Traders need to be aware of these risks and adjust their strategies accordingly.
Regulatory Environment
The regulatory environment is becoming increasingly complex, with geopolitical tensions influencing market conditions. The Pentagon's actions are part of a broader strategy to counter perceived threats from Chinese companies. This adds another layer of risk for investors, who must now consider not only market fundamentals but also geopolitical factors.
Comparative Analysis
To understand the broader market implications, traders can utilize MarketVibe's metrics such as the Crash Warning Index (CWI) and % Above 50-DMA. The CWI, currently at 5.0, suggests elevated risk levels, indicating that traders should be cautious. This index is a composite measure that includes breadth, volatility, and defensive behavior, providing a comprehensive view of market risk.
The % Above 50-DMA is another critical metric, measuring the percentage of stocks trading above their 50-day moving average. A low percentage indicates weak market breadth, which, combined with a high CWI, suggests a cautious approach is warranted.
Future Outlook
Looking ahead, the situation with Alibaba and BYD could lead to further market volatility. Traders should monitor these developments closely, using MarketVibe's Decision Edge Dashboard to stay informed about changes in market conditions and risk levels.
Real-World Scenarios
Scenario 1: Topping Environment
Imagine a scenario where the broader market indices are grinding higher, but the % Above 50-DMA is declining. This indicates that fewer stocks are participating in the rally, a classic sign of a market topping environment. Traders might be tempted to chase the rally, but a more informed approach would be to reduce exposure and prepare for potential corrections.
Scenario 2: Bull Market Surge
In a strong bull market, the % Above 50-DMA might surge and remain elevated, indicating robust market breadth. This scenario suggests that traders can be more open to increasing exposure, provided their setups align with the broader market trend.
Scenario 3: Volatility Spike
A sudden increase in market volatility, reflected by a spike in ATR% (Average True Range as a percentage of price), could coincide with a rising CWI. This combination often signals heightened risk and the potential for sharp market movements. Traders should consider defensive strategies, such as hedging or reducing position sizes.
How to Use This Insight in a Process
To incorporate these insights into a trading process, consider the following guidelines:
- When breadth is weak and CWI is high, emphasize defense and reduce new risk. This might involve tightening stop losses or reducing position sizes.
- When breadth and leadership broaden out, you can be more open to adding exposure, but only if your setups are there. This means looking for strong technical patterns and favorable risk-reward ratios.
- Use the Market Dashboard as a high-level regime label, then check internals for confirmation. This approach helps maintain a structured process and avoids emotional decision-making.
Common Misuses & Misconceptions
Traders often misuse these metrics by:
- Treating them as stand-alone entry signals: These metrics should guide risk posture, not dictate specific trades.
- Ignoring context: It's crucial to consider sector rotation and broader market conditions.
- Overreacting to one-day changes: Short-term fluctuations can be misleading; focus on trends and patterns.
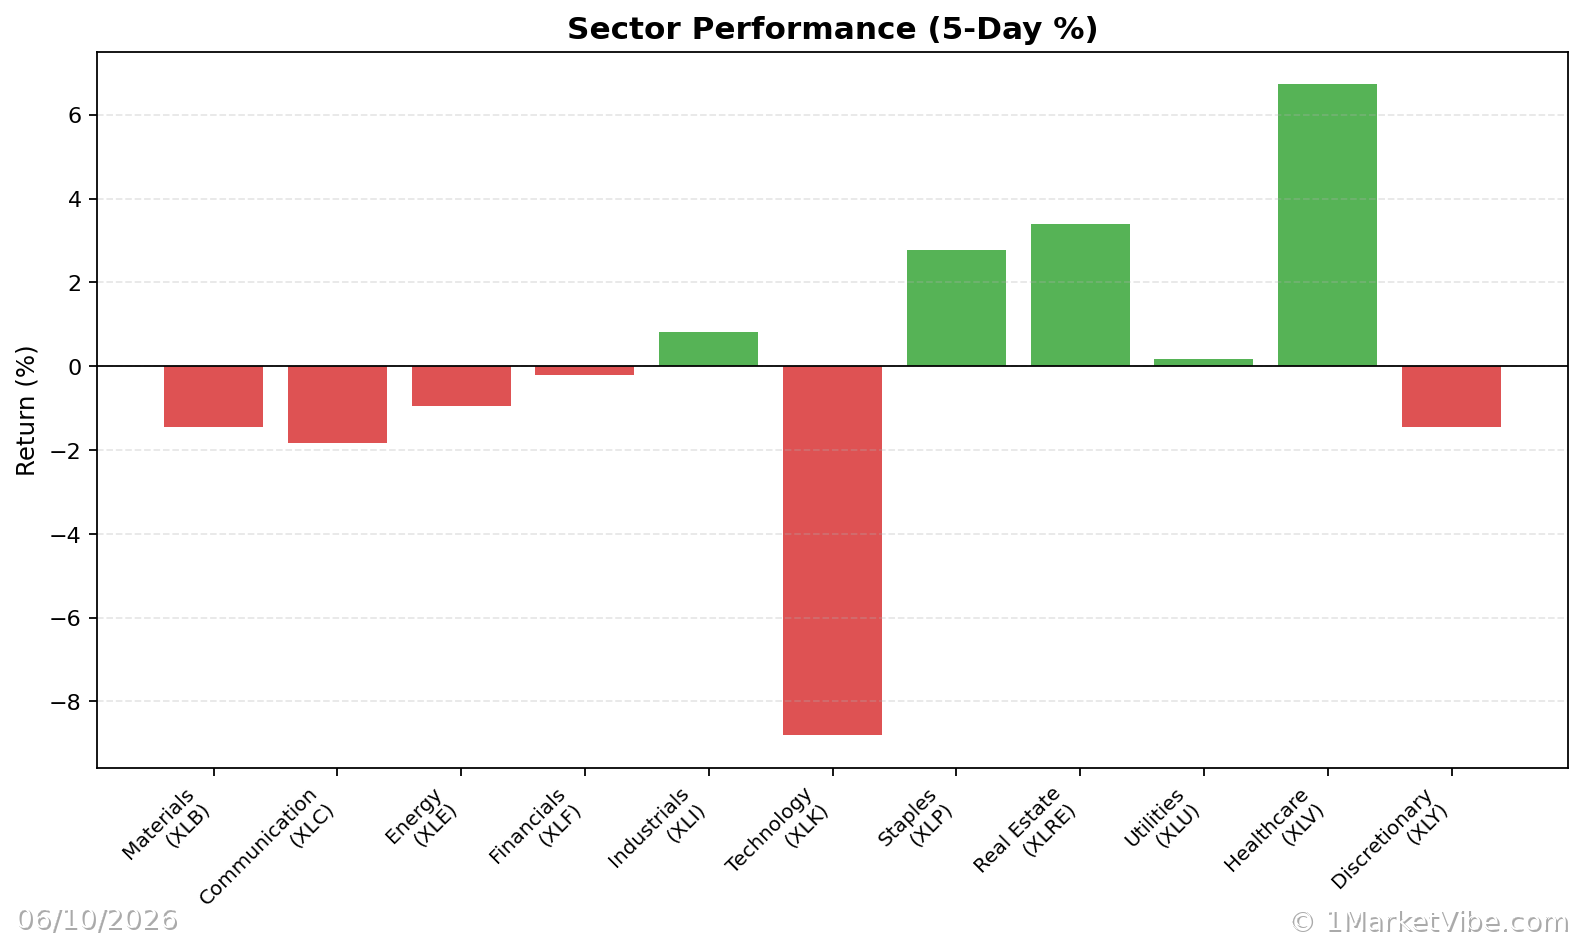
By understanding these metrics and their implications, traders can make more informed decisions and better navigate the complexities of the market.
To see these breadth and risk metrics in one place each day, you can use the Decision Edge dashboard at 1marketvibe.com.
DISCLAIMER: This article is for informational purposes only and does not constitute financial advice. Always consult with a financial advisor before making investment decisions.