
CW Index at 7.4: Essential Strategies for Investors
In the complex world of trading, understanding the underlying market dynamics is crucial for making informed decisions. One of the key metrics that traders and investors rely on is the Crash Warning Index (CWI). This composite index offers insights into the potential risk of market corrections by analyzing several dimensions of market behavior. As of now, the CWI stands at 7.4, indicating an elevated risk environment. This article will delve into the mechanics of the CWI, its implications, and strategies investors can employ to navigate these conditions effectively.
Understanding the Crash Warning Index (CWI)
The Crash Warning Index is a sophisticated tool that aggregates various market indicators to assess the likelihood of a significant market downturn. It incorporates elements such as market breadth, volatility, and defensive sector behavior to provide a comprehensive risk assessment. Traders should care about the CWI because it helps inform decisions about risk management and portfolio adjustments, reducing blind spots that might otherwise lead to unexpected losses.
How the CWI Works
Conceptually, the CWI is constructed by analyzing:
- Market Breadth: This involves the percentage of stocks trading above their 50-day moving average, offering a view of the overall market trend.
- Volatility Measures: Metrics like the Average True Range percentage (ATR%) indicate the market's volatility regime.
- Defensive Behavior: The performance of defensive sectors relative to the broader market can signal shifts in investor sentiment.
Each of these components contributes to the CWI, which is then expressed as a numerical value. A higher CWI suggests increased risk, while a lower value indicates a more stable market environment. The index is dynamic, changing with daily market conditions as new data impacts its constituent metrics.
Interpreting the CWI Levels
The CWI provides valuable insights into market conditions through its various levels:
- Below 3: Generally indicates a low-risk environment where market conditions are stable.
- Between 3 and 6: Suggests moderate risk, where caution is advised, but opportunities may still exist.
- Above 6: Represents elevated risk, where corrections are more likely, and defensive strategies should be considered.
Currently, with the CWI at 7.4, the market is in a high-risk zone. This level has historically been associated with increased volatility and potential market corrections, prompting investors to reassess their risk exposure.
Common Combinations and Their Implications
- Strong Breadth + Low Volatility: Typically seen in healthy bull markets, where risk-taking is rewarded.
- Weak Breadth + Rising Volatility: Often precedes market corrections, as seen with the current CWI level.
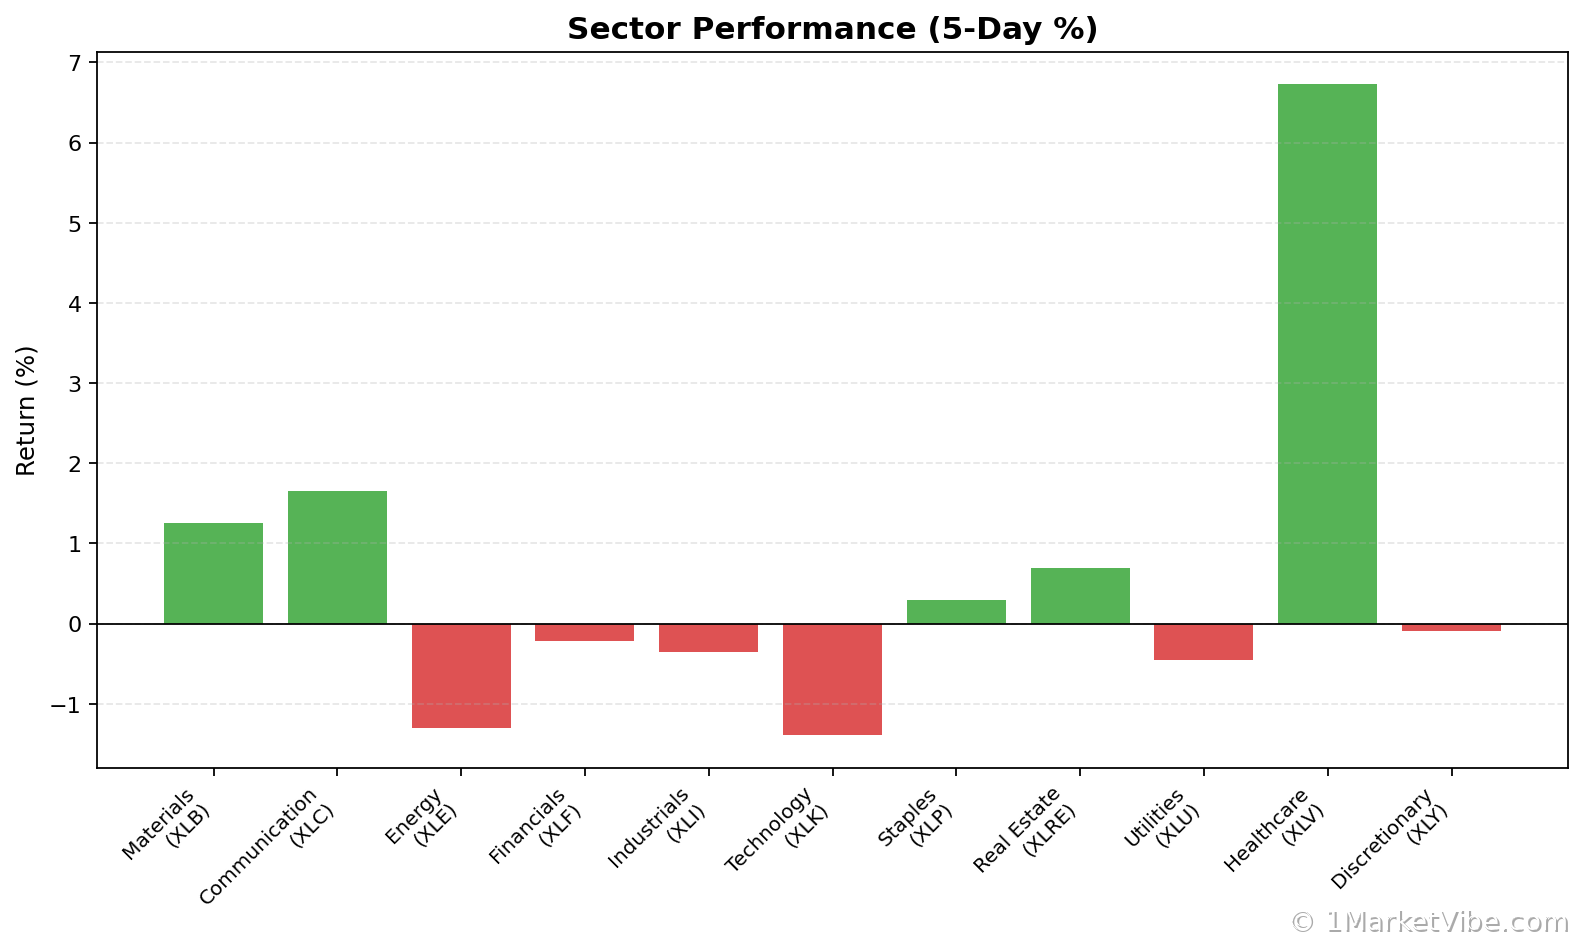
- Defensive Sectors Leading: Indicates a shift towards risk aversion, aligning with elevated CWI readings.
Real-World Scenarios
To illustrate how the CWI manifests in real market conditions, consider the following scenarios:
Scenario 1: Topping Environment
Imagine a market where major indices are reaching new highs, but the percentage of stocks above their 50-day moving average is declining. The CWI rises as volatility increases and defensive sectors like utilities and consumer staples outperform. Traders might feel tempted to chase the rally, but a more informed approach would be to reduce exposure and prepare for a potential pullback.
Scenario 2: Bull Market Resurgence
In a scenario where the CWI drops below 3, market breadth improves significantly, and volatility remains low, a new bull leg could be underway. Here, traders might consider increasing exposure, provided their setups align with the broader market trend.
Scenario 3: Volatility Spike
Suppose a sudden geopolitical event causes a spike in volatility, pushing the CWI above 6. In this case, the market might experience sharp swings, and traders should focus on preserving capital, possibly through hedging strategies or reducing position sizes.
Integrating CWI Insights into Your Process
To effectively incorporate the CWI into your trading strategy, consider the following guidelines:
- Emphasize Defense: When the CWI is high, prioritize capital preservation. This might involve reducing position sizes or increasing cash allocations.
- Monitor Breadth and Leadership: Use the Market Dashboard to assess market breadth and sector leadership. A broadening market with strong leadership can signal a safer environment for risk-taking.
- Adjust Exposure: Align your risk exposure with the CWI levels. High CWI readings suggest caution, while lower readings may allow for more aggressive positioning.
Common Misuses and Misconceptions
Traders often misuse the CWI by:
- Using it as a Stand-Alone Signal: The CWI should be part of a broader analysis, not a sole decision-making tool.
- Ignoring Context: Always consider sector rotation and broader market conditions when interpreting the CWI.
- Overreacting to Daily Changes: Focus on trends rather than day-to-day fluctuations to avoid unnecessary trading.
A healthier approach involves integrating the CWI with other MarketVibe metrics and maintaining a disciplined risk management strategy.
To see these breadth and risk metrics in one place each day, you can use the Decision Edge dashboard at 1marketvibe.com.
INVESTMENT DISCLAIMER: This analysis is provided for informational purposes only and does not constitute investment advice, a recommendation, or an offer or solicitation to buy or sell any securities. MarketVibe content reflects observable market data and historical context as of the publication date and should not be construed as personalized investment advice. Market conditions can change rapidly and unpredictably.