
CW Index at 6.2: Strategic Adjustments in a Volatile Tech Landscape
- Authors

- Name
- MarketVibe Team
- @1marketvibe
CW Index at 6.2: Strategic Adjustments in a Volatile Tech Landscape
Introduction
In the current landscape of the U.S. stock market, volatility has become a defining feature, particularly within the technology sector. As traders navigate this challenging environment, understanding the underlying market dynamics is crucial. One key metric that can provide valuable insights is the Crash Warning Index (CWI), which has recently reached a level of 6.2. This article will explore the implications of this reading, especially in the context of the tech sector's volatility, and suggest strategic adjustments for traders.
What is the Crash Warning Index (CWI)?
The Crash Warning Index (CWI) is a composite metric designed to assess the risk of significant market corrections. It combines several dimensions of market risk, including breadth, volatility, and defensive behavior, to provide a comprehensive view of market conditions. Traders should care about the CWI because it helps inform decisions about risk management and portfolio adjustments. It reduces blind spots by highlighting periods of elevated risk, allowing traders to adjust their strategies accordingly.
How the CWI Works
The CWI is constructed by analyzing various market indicators:
- Breadth: Measures the number of stocks participating in market movements. A decline in breadth, where fewer stocks are above their 50-day moving average, can indicate weakening market support.
- Volatility: Assessed through metrics like ATR% (Average True Range as a percentage of price), which indicates how much the market is moving relative to its price.
- Defensive Behavior: Observes shifts towards defensive sectors, such as utilities or consumer staples, which often lead during risk-averse periods.
The CWI moves based on changes in these underlying components. For example, if market breadth deteriorates while volatility increases, the CWI is likely to rise, signaling heightened risk.
Interpreting CWI Levels
CWI Ranges and Implications:
- Below 3: Generally indicates a stable market environment with low risk of correction.
- 3 to 6: Suggests caution, as risks are increasing but not yet at critical levels.
- Above 6: Signals elevated risk, where market corrections become more likely.
When the CWI remains above 6 for several days, it often correlates with increased market volatility and potential corrections. This is particularly relevant when combined with weak breadth and rising volatility.
Real-World Scenarios
Scenario 1: Topping Environment
Imagine a scenario where the major indices are grinding higher, but the number of stocks making new highs is declining. The CWI might rise above 6, indicating that while the index levels appear strong, the underlying market is weakening. Traders might feel tempted to chase the rally, but a more informed view would suggest caution and potential defensive positioning.
Scenario 2: Volatility Spike
Consider a sudden increase in market volatility, reflected by a jump in ATR%. The CWI could quickly escalate, warning of potential market turbulence. In this case, traders might be inclined to panic sell, but understanding the CWI's warning could lead to more strategic risk management, such as adjusting position sizes or employing hedging strategies.
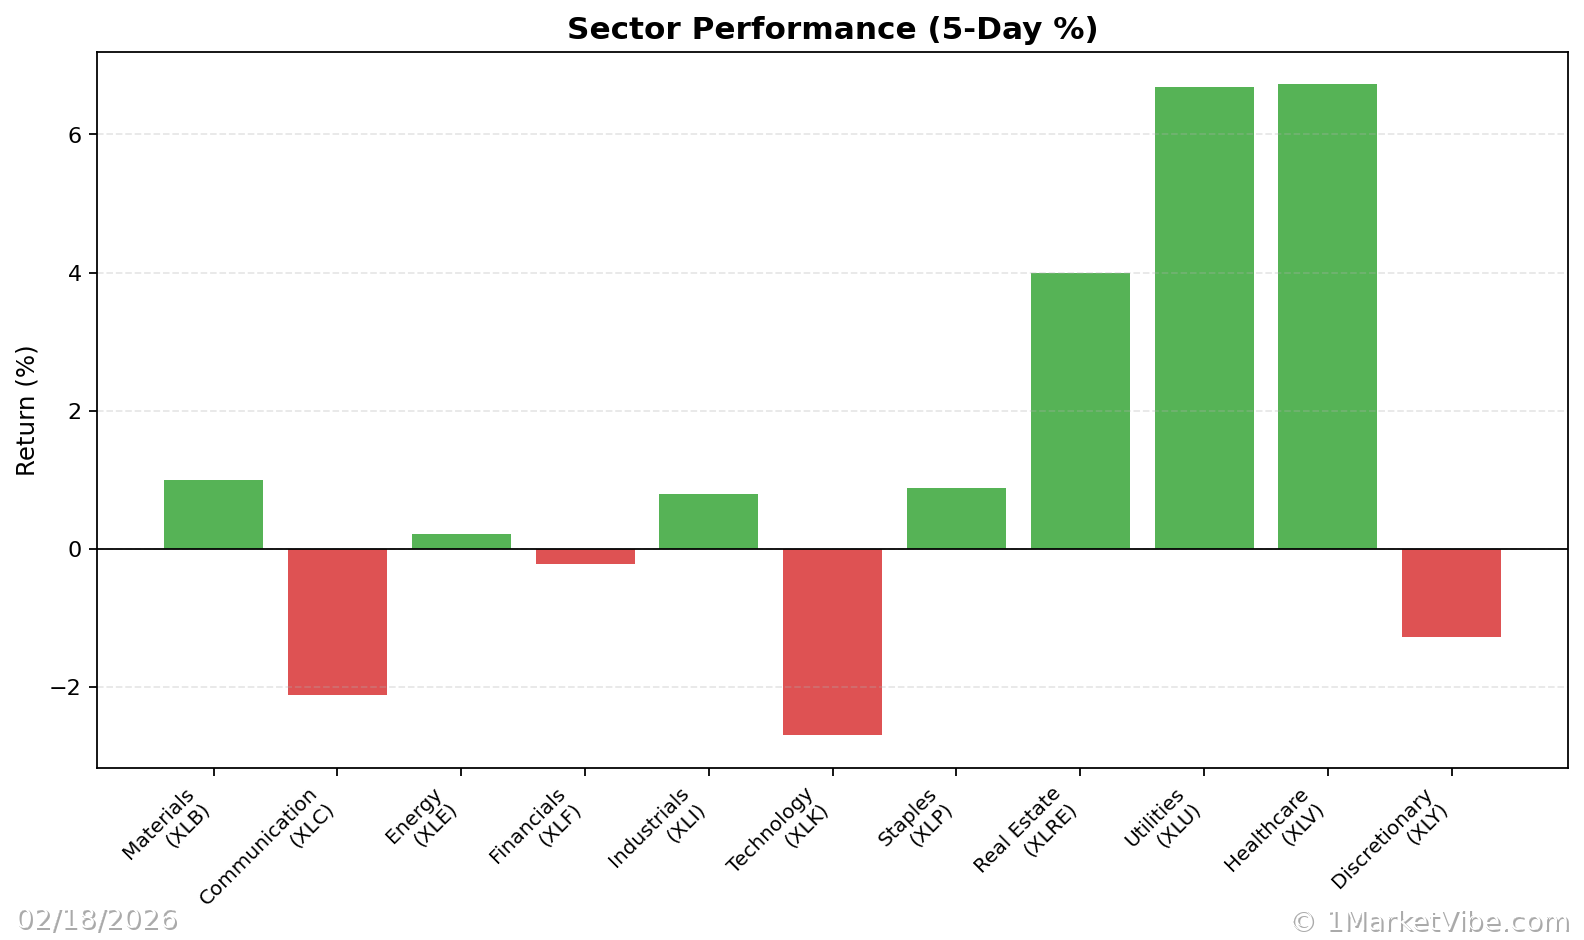
Scenario 3: Tech Sector Volatility
In the current market, the tech sector has experienced a multiweek slide. The CWI at 6.2 suggests that this volatility might persist. Traders observing this might consider reducing exposure to tech stocks or diversifying into less volatile sectors until the CWI indicates a more stable environment.
How to Use CWI in a Trading Process
Practical Guidelines:
- Emphasize Defense: When the CWI is high and breadth is weak, prioritize risk management. This might involve reducing new positions or tightening stop-loss levels.
- Monitor for Broadening Leadership: If the CWI begins to decline and breadth improves, it could signal a safer environment to increase exposure, provided your setups align.
- Use the Market Dashboard: Leverage MarketVibe's Decision Edge dashboard to get a high-level view of market regimes and confirm insights with internal metrics.
Common Misuses & Misconceptions
Treating CWI as a Stand-Alone Signal: The CWI should not be used in isolation. It is a guide for risk posture, not a precise timing tool.
Ignoring Context: Traders often overlook sector rotation or broader market trends. Always consider the CWI within the context of other market indicators and news.
Overreacting to Daily Changes: The CWI is more valuable as a trend indicator rather than reacting to daily fluctuations. Focus on sustained levels above or below key thresholds.
To see these breadth and risk metrics in one place each day, you can use the Decision Edge dashboard at 1marketvibe.com.
Disclaimer: The information provided in this article is for educational purposes only and should not be considered as financial advice. Market conditions can change rapidly, and past performance is not indicative of future results.