

CW Index at 5.33: Managing Market Risks During Federal Reserve Pause
- Authors

- Name
- MarketVibe Team
- @1marketvibe
CW Index at 5.33: Managing Market Risks During Federal Reserve Pause
1. Orientation – What Are We Explaining?
In this article, we focus on the Crash Warning Index (CWI), a crucial metric for traders seeking to understand and manage market risks, especially during periods of significant economic events like a Federal Reserve pause. The CWI is a composite indicator that aggregates various dimensions of market risk, including breadth, volatility, and defensive behavior.
Why should traders care? The CWI helps traders make informed decisions about risk management by providing an early warning of potential market corrections. It reduces blind spots by highlighting underlying market stress that might not be visible through price action alone. Incorporating the CWI into a structured trading process allows traders to adjust their risk posture proactively, rather than reactively.
2. How It Works – Mechanics & Data
The Crash Warning Index (CWI) is constructed by combining several market indicators that reflect different aspects of market health:
- Breadth: Measures the number of stocks advancing versus declining. A narrowing breadth, where fewer stocks are participating in a rally, can indicate underlying weakness.
- Volatility: Assessed through metrics like ATR% (Average True Range as a percentage of price), which indicates the level of price fluctuation.
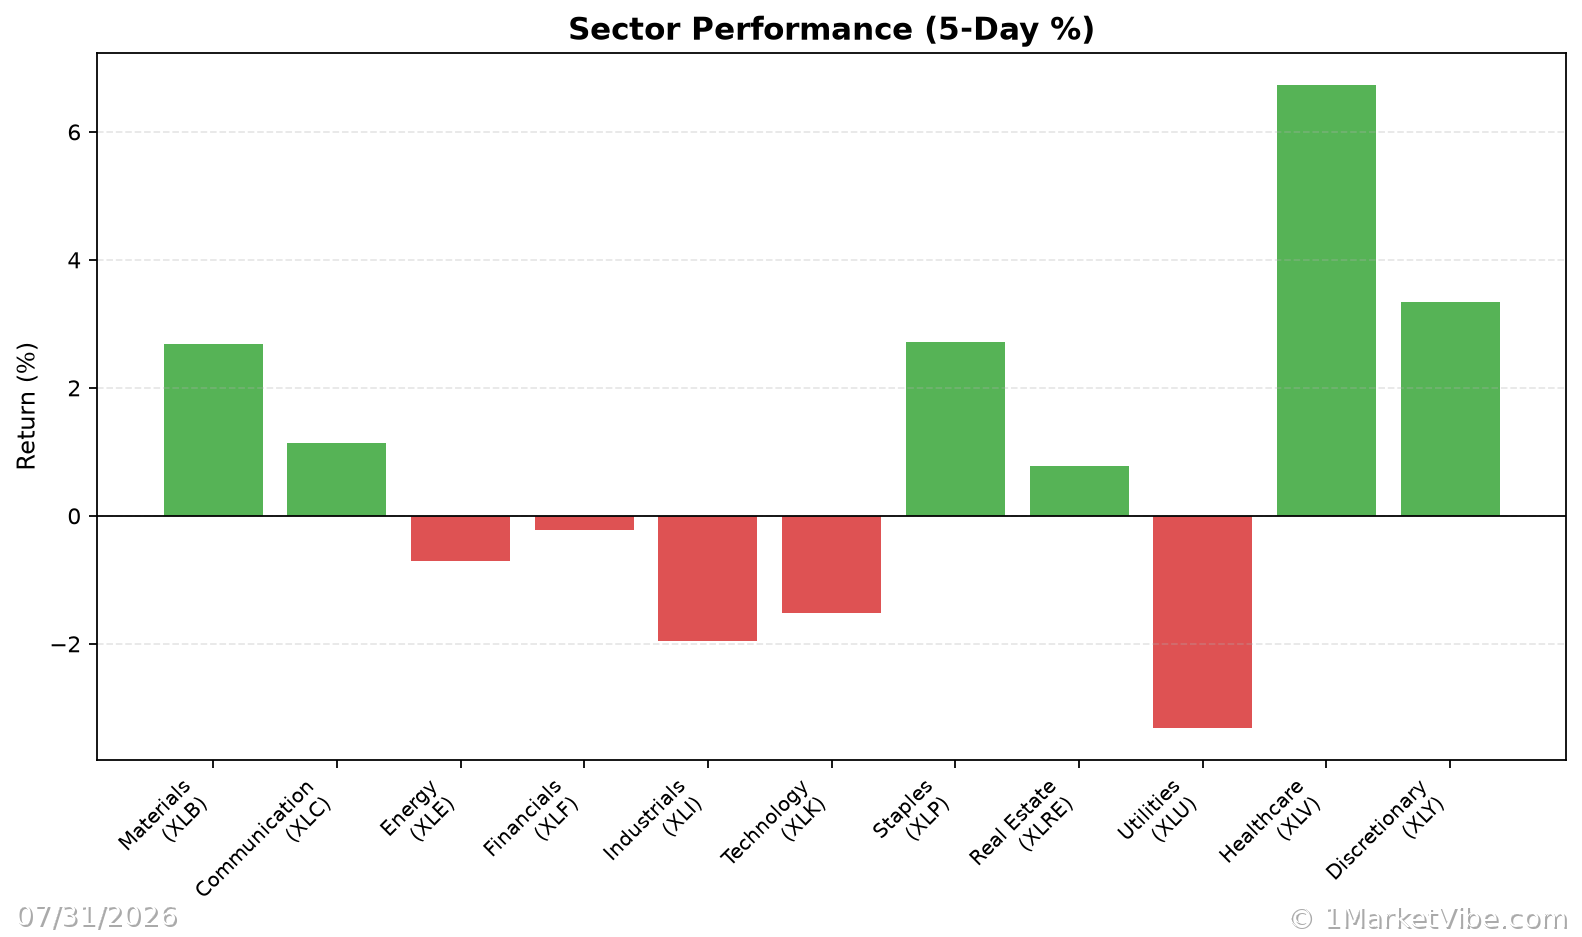
- Defensive Behavior: Observes the performance of defensive sectors (e.g., utilities, consumer staples) relative to the broader market.
The CWI is a dynamic metric that changes as these underlying components fluctuate. For instance, a surge in market volatility or a contraction in breadth can cause the CWI to rise, signaling increased risk.
3. Interpretation – What Different Levels Tend to Mean
CWI Ranges and Implications:
- Below 3: Generally indicates a stable market environment with low risk of correction. Traders might feel more comfortable taking on risk.
- 3 to 6: Suggests rising caution. While not yet at extreme levels, this range often precedes periods of increased market volatility or corrections.
- Above 6: Signals elevated risk. Historically, a CWI above 6 has been associated with heightened market stress and a higher likelihood of significant corrections.
Common Combinations:
- Strong Breadth + Low Volatility: Typically a healthy market environment, conducive to risk-taking.
- Weak Breadth + Rising Volatility: Often a precursor to market corrections, warranting a defensive stance.
- Defensive Sectors Leading: When defensive sectors outperform, it often signals risk aversion among investors.
4. Real-World Scenarios – How This Shows Up in Markets
Scenario 1: Topping Environment
Imagine a scenario where the market index continues to climb, but the breadth deteriorates. The CWI might rise from 3.5 to 5.3 as fewer stocks participate in the rally. Traders might be tempted to chase the rising index, but a more informed view would recognize the underlying weakness and adopt a cautious approach.
Scenario 2: Bull Market Leg
In a strong bull market leg, the % Above 50-DMA surges, and the CWI remains below 3. This indicates broad participation and low risk, encouraging traders to increase exposure, provided their setups align.
Scenario 3: Volatility Spike
Consider a sudden geopolitical event causing market volatility to spike. The ATR% jumps, and the CWI climbs from 4 to 6.5. While the instinct might be to panic sell, understanding the CWI's warning allows traders to manage risk through hedging or reducing exposure in high-risk sectors.
5. How to Use This Insight in a Process
Practical Guidelines:
- High CWI Levels: When the CWI is high, focus on defense. Reduce new risk, consider hedging strategies, and prioritize capital preservation.
- Broadening Breadth and Leadership: When breadth and leadership improve, be open to adding exposure, but ensure your setups are robust.
- Market Dashboard as a Guide: Use the Market Dashboard to identify the overall market regime, then delve into internals like the CWI for confirmation.
6. Common Misuses & Misconceptions
Misuse 1: Stand-Alone Signal
Traders often misuse the CWI as a stand-alone entry signal. Instead, use it as part of a broader analysis that includes other market indicators.
Misuse 2: Ignoring Context
Ignoring sector rotation or time frame can lead to misinterpretation. Always consider the broader market context when evaluating the CWI.
Misuse 3: Overreacting to Daily Changes
The CWI is a composite metric that reflects underlying trends. Avoid overreacting to one-day changes; focus on sustained trends.
To see these breadth and risk metrics in one place each day, you can use the Decision Edge dashboard at 1marketvibe.com.
Disclaimer: This article is for educational purposes only and does not constitute financial advice. Please consult with a financial advisor before making any investment decisions.