China's $28 Trillion Market Strategy and Its Impact on Global AI Power
- Authors

- Name
- MarketVibe Team
- @1marketvibe
China's $28 Trillion Market Strategy and Its Impact on Global AI Power
Introduction
China's ambitious market strategy, with its staggering $28 trillion capital market, is a focal point in the global race for artificial intelligence (AI) dominance. As China strives to surpass the United States in AI capabilities, understanding the underlying market dynamics and strategic investments is crucial for traders and investors. This article will explore China's market strategy, its implications for global AI power, and how traders can leverage MarketVibe's metrics to navigate these developments.
China's Capital Market Strategy
China's capital market strategy is centered around significant investments in AI and technology sectors. The government has implemented policies to foster AI development, aiming to make China a global leader in AI by 2030. This involves substantial funding for research and development, infrastructure improvements, and talent acquisition.
Why Traders Should Care:
- Investment Decisions: Understanding China's strategy helps traders identify potential investment opportunities in AI and technology sectors.
- Risk Management: Awareness of China's market moves can inform risk exposure adjustments, especially in sectors heavily influenced by AI advancements.
Comparative Analysis: U.S. vs. China
The U.S. has traditionally led in AI innovation, with major tech companies like Google and Microsoft at the forefront. However, China's rapid progress, supported by its vast market and government backing, poses a significant challenge.
Key Players:
- China: Alibaba, Tencent, Baidu
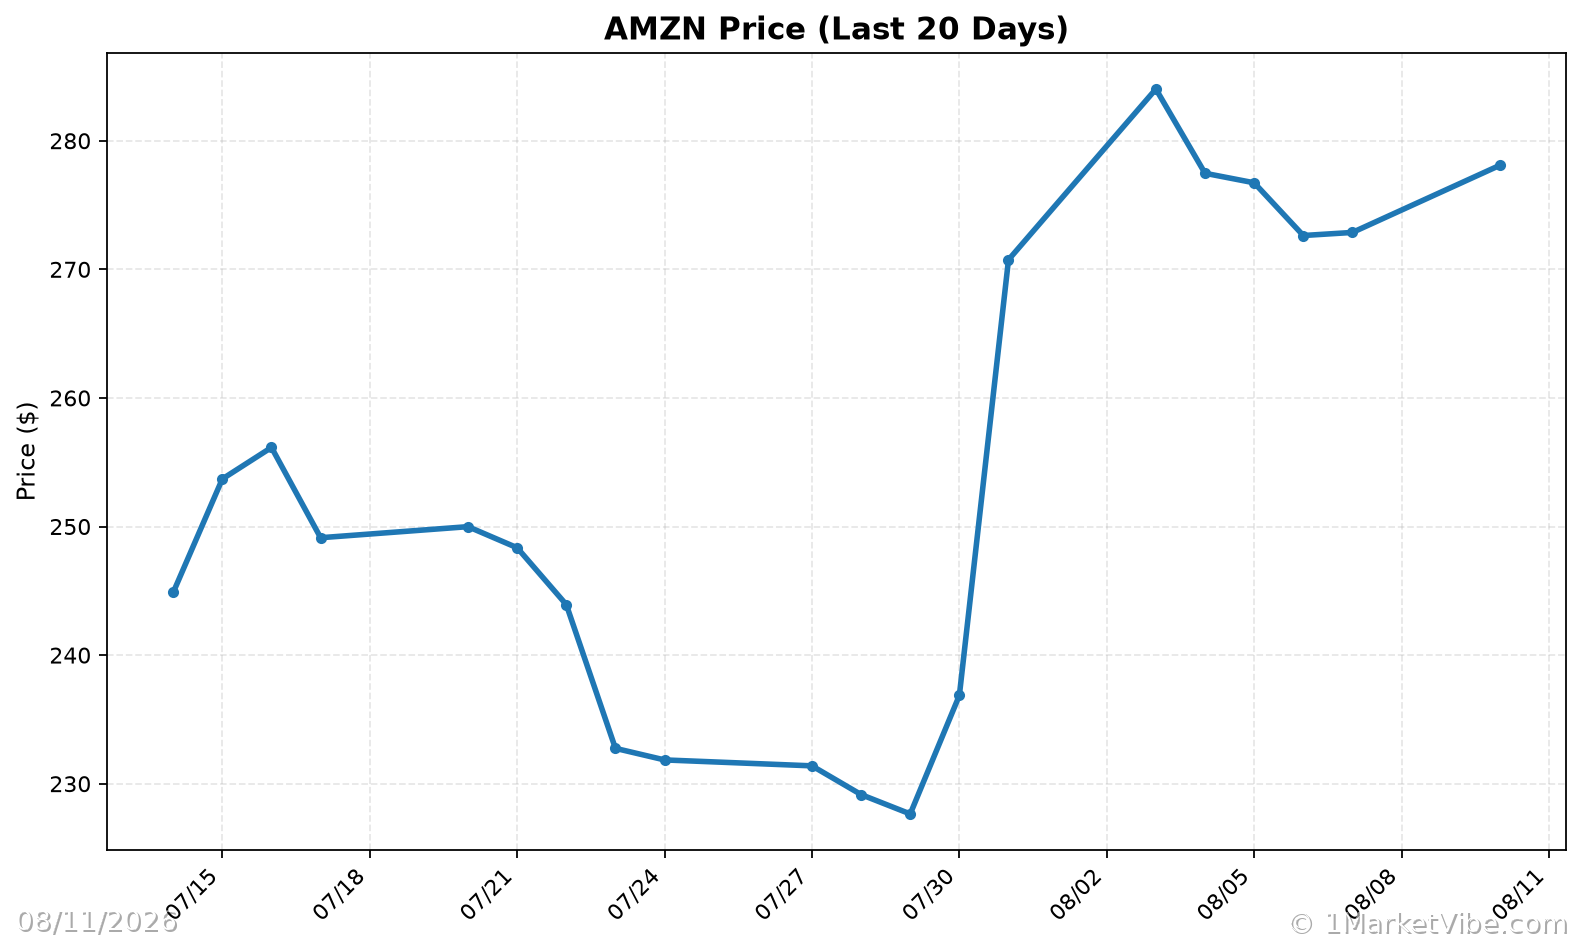
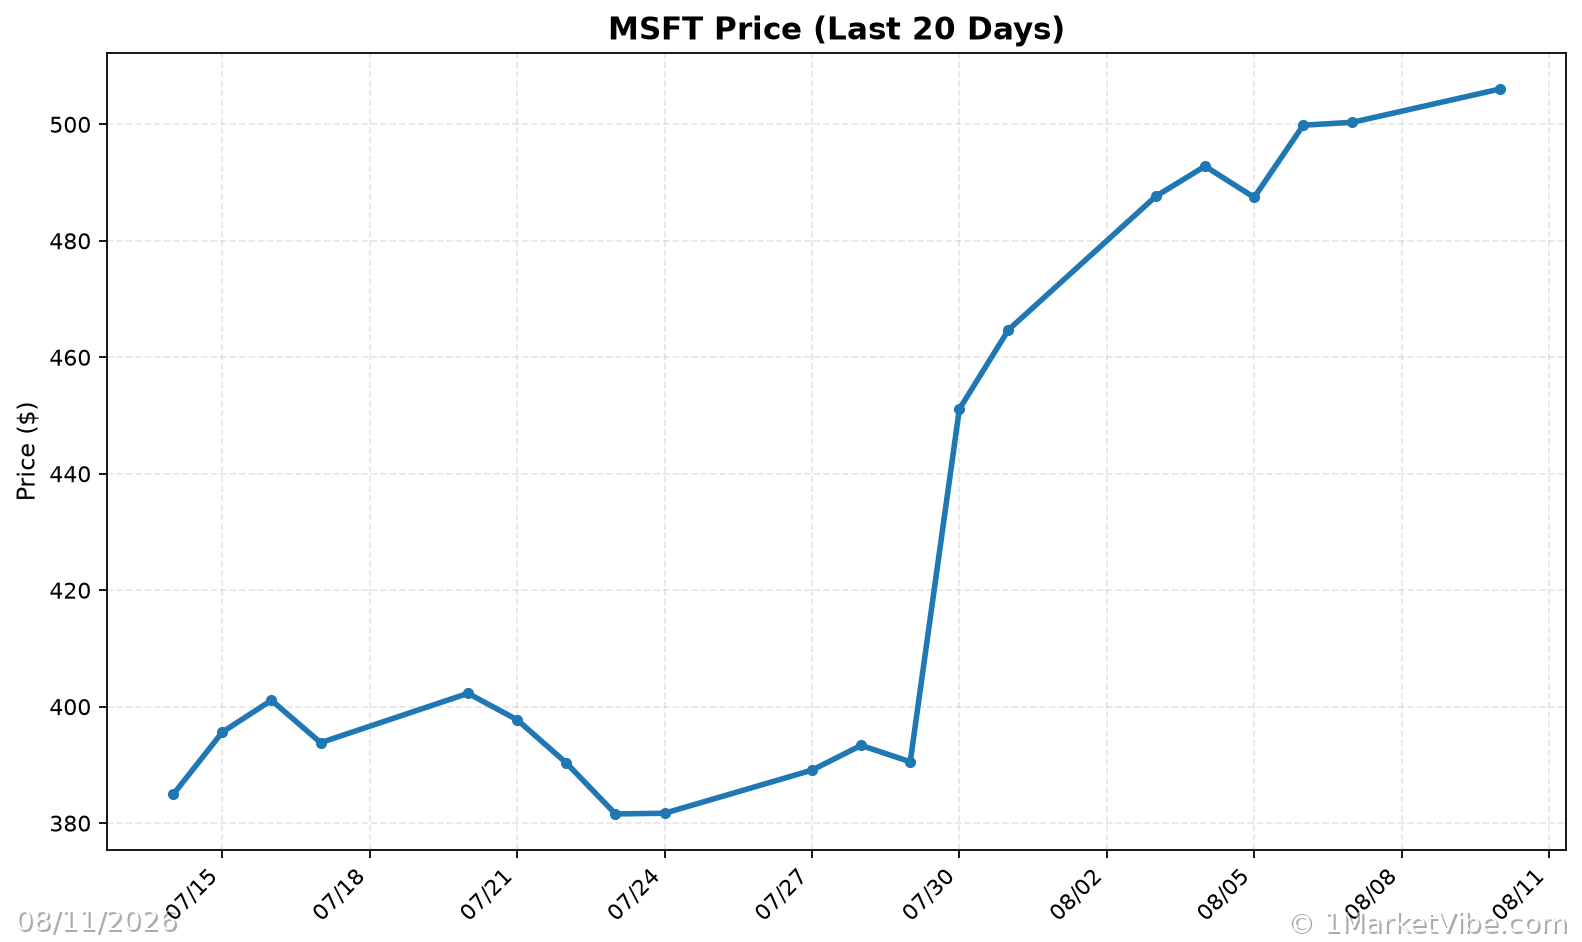
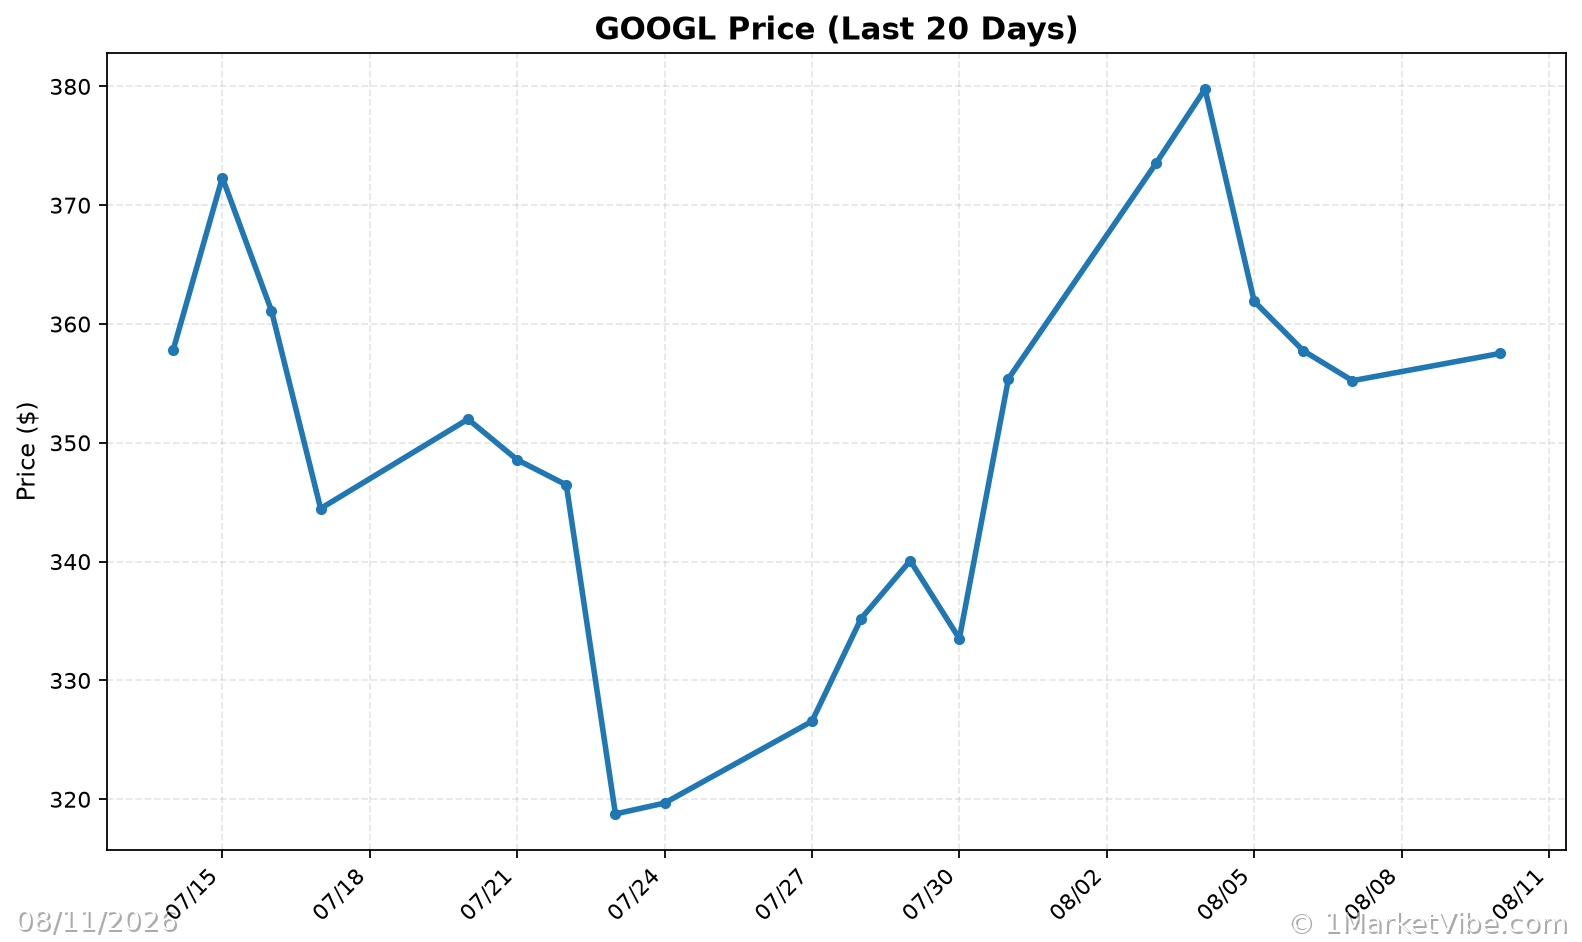
- U.S.: Google, Microsoft, Amazon
Potential Impacts on Global Economy
China's aggressive market strategy could shift global investment flows and market dynamics. As China strengthens its AI capabilities, international trade and partnerships may evolve, impacting global economic structures.
MarketVibe Metrics Connection:
- Crash Warning Index (CWI): Currently at 5.4, indicating elevated risk levels. Traders should monitor this as China's market strategy unfolds.
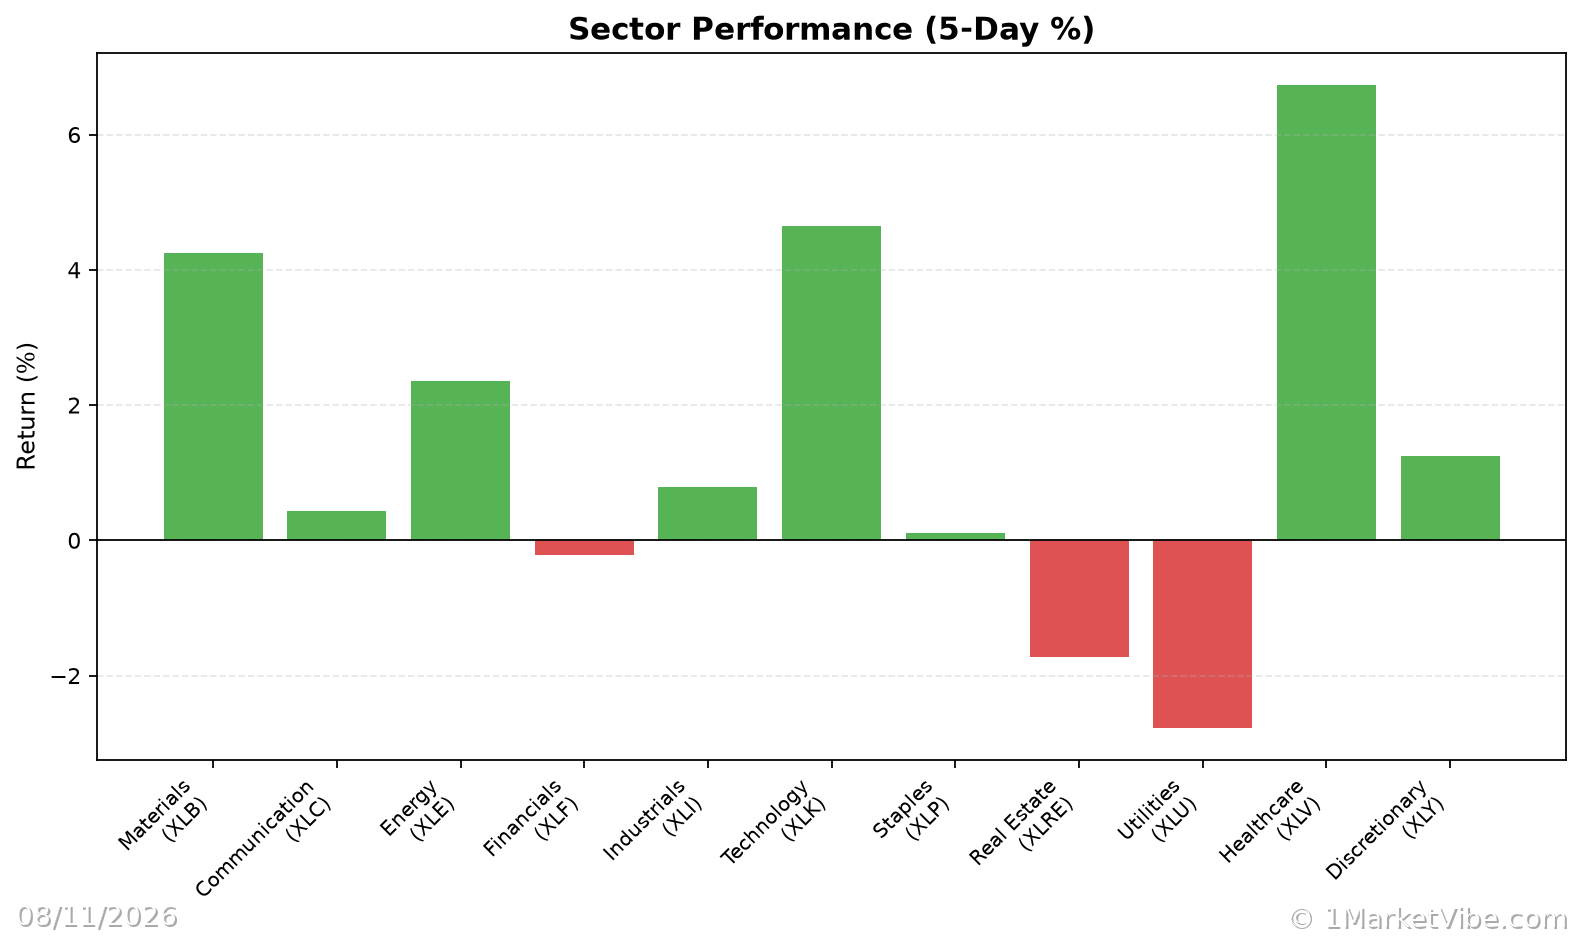
- % Above 50-DMA: A breadth indicator that can reflect the health of market trends in AI-related sectors.
Challenges Facing China
Despite its ambitions, China faces several challenges, including regulatory hurdles, market access issues, and technological gaps. Talent shortages in AI expertise also pose a significant barrier to achieving its goals.
U.S. Response Strategies
To maintain its competitive edge, the U.S. is likely to adjust policies and increase investments in domestic AI innovation. This includes enhancing research funding and fostering public-private partnerships.
Market Sentiment and Predictions
Current market sentiment towards AI investments is cautiously optimistic. Experts predict continued growth in AI sectors, but with potential volatility as global power dynamics shift.
Example Scenarios:
- Topping Environment: As China's AI sector grows, breadth indicators like % Above 50-DMA may show deterioration even if indices rise, signaling caution.
- Bull Leg Surge: A surge in AI investments could lead to a strong bull market, with % Above 50-DMA remaining elevated, indicating robust trend health.
- Volatility Spike: Rising geopolitical tensions or regulatory changes could cause ATR% to spike, signaling increased market volatility.
How to Use This Insight in a Process
- Risk Posture: When CWI is high and breadth is weak, emphasize defensive strategies and reduce new risk exposure.
- Exposure Adjustment: Broaden exposure when breadth and leadership indicators strengthen, but ensure setups align with your strategy.
- Market Dashboard Utilization: Use MarketVibe's Decision Edge dashboard to monitor breadth, CWI, and climate for informed decision-making.
Common Misuses & Misconceptions
- Standalone Signal Misuse: Avoid using metrics like CWI or % Above 50-DMA as standalone entry signals. They should guide risk posture, not precise timing.
- Ignoring Context: Consider sector rotation and broader market context when interpreting metrics.
- Overreacting to Daily Changes: Focus on trends and sustained movements rather than reacting to short-term fluctuations.
To see these breadth and risk metrics in one place each day, you can use the Decision Edge dashboard at 1marketvibe.com.
Disclaimer: This article is for informational purposes only and does not constitute financial advice. Please consult a financial advisor before making investment decisions.
Charts