

Bitcoin Reaches $85K: Is the Crypto Winter Coming to an End?
- Authors

- Name
- MarketVibe Team
- @1marketvibe
Bitcoin Reaches $85K: Is the Crypto Winter Coming to an End?
Bitcoin's recent surge to $85,000 has captured the attention of traders and investors worldwide. This milestone raises a critical question: Is the long-standing crypto winter finally thawing? To understand this, we need to explore the underlying market dynamics and how traders can use MarketVibe's metrics to navigate this environment effectively.
Orientation – What Are We Explaining?
In this article, we'll delve into the Market Dashboard and its associated metrics, which provide a comprehensive view of market conditions. These tools are crucial for traders as they help inform decisions, reduce blind spots, and fit into a structured trading process. The Market Dashboard, along with metrics like the Crash Warning Index (CWI), % Above 50-DMA, and ATR%, offers insights into market breadth, volatility, and risk conditions.
Understanding these metrics is not about finding a magic signal but about building a robust framework for making informed trading decisions. By examining these indicators, traders can better assess whether Bitcoin's rally is sustainable and how it fits into the broader market context.
How It Works – Mechanics & Data
Market Dashboard
The Market Dashboard is the front page of MarketVibe's risk picture. It aggregates various indicators to provide a snapshot of market health. It includes metrics like:
- % Above 50-DMA: This measures the percentage of stocks trading above their 50-day moving average, indicating trend health and breadth.
- ATR%: Average True Range as a percentage of price, which gauges market volatility.
- A/D Net: The net number of advancing stocks minus declining stocks, reflecting internal market strength.
- NH–NL: New Highs minus New Lows, showing expansion or contraction in market leadership.
Crash Warning Index (CWI)
The CWI is a composite index that assesses several risk dimensions, including breadth, volatility, and defensive behavior. It helps traders identify elevated risk conditions. A CWI above 6 suggests heightened risk and potential for corrections.
% Above 50-DMA
This metric evaluates the proportion of stocks above their 50-day moving average. A high percentage indicates strong market breadth and a healthy trend, while a low percentage suggests weakness or oversold conditions.
Interpretation – What Different Levels Tend to Mean
Market Dashboard States
- Strong Breadth + Low Volatility: Indicates a stable, trending market. Traders can consider increasing exposure if setups align.
- Weak Breadth + Rising Volatility: Signals potential market instability. Emphasize defensive strategies and reduce new risk.
- Defensive Sectors Leading: Often occurs when the market is in a Warning or At-Risk climate, suggesting caution.
CWI Levels
- CWI Above 6: Elevated risk, corrections more likely. Focus on risk management and defensive positioning.
- CWI Below 3: Lower risk, market may be in a stable phase. Consider adding exposure if other indicators confirm.
Real-World Scenarios – How This Shows Up in Markets
Scenario 1: Topping Environment
Imagine Bitcoin has reached $85K, but the % Above 50-DMA drops below 40%. This suggests deteriorating breadth even as prices climb, a potential sign of a topping market. Traders might feel tempted to chase the rally, but a more informed view would focus on risk management and watch for further breadth deterioration.
Scenario 2: Strong Bull Leg
In a scenario where Bitcoin's rally is accompanied by a % Above 50-DMA surging above 70% and staying elevated, it indicates a robust bull market. Traders can consider adding exposure, provided their setups align and risk management protocols are in place.
Scenario 3: Volatility Spike
If Bitcoin's price surge is accompanied by a sharp increase in ATR%, it suggests heightened volatility. The CWI might also accelerate, indicating increased risk. Traders should be cautious, focusing on defensive strategies and avoiding overexposure.
How to Use This Insight in a Process
- Weak Breadth + High CWI: Emphasize defense, reduce new risk, and focus on capital preservation.
- Strong Breadth + Broad Leadership: Be open to adding exposure if setups are present, but maintain disciplined risk management.
- Use Market Dashboard: As a high-level regime label, then check internals for confirmation before making decisions.
These guidelines help traders adjust their risk posture and expectations based on market conditions, rather than relying on precise timing.
Common Misuses & Misconceptions
- Treating Metrics as Stand-Alone Signals: Avoid using a single metric as an entry or exit signal. Instead, consider the broader market context and multiple indicators.
- Ignoring Sector Rotation: Pay attention to sector performance and rotation, as they provide clues about market leadership and trends.
- Overreacting to One-Day Changes: Focus on trends and sustained movements rather than reacting to daily fluctuations.
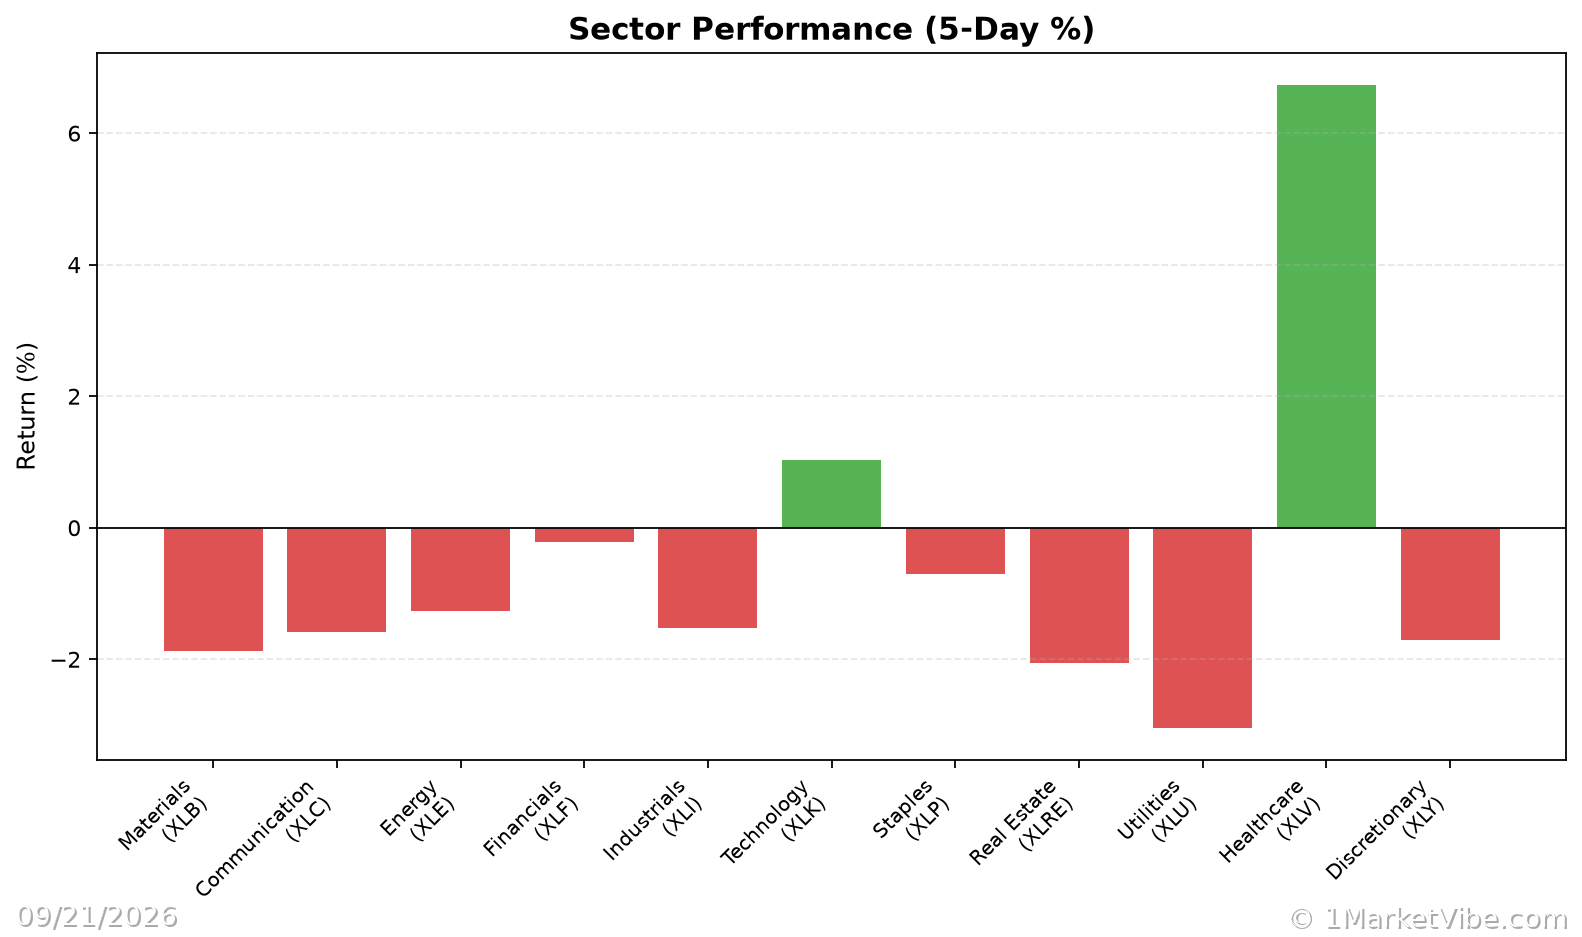
To see these breadth and risk metrics in one place each day, you can use the Decision Edge dashboard at 1marketvibe.com.
DISCLAIMER: This article is for informational purposes only and should not be considered financial advice. Always conduct your own research before making investment decisions.