AI Sell-Off Triggers 10% Drop and Exposes Chipmaker Risks
- Authors

- Name
- MarketVibe Team
- @1marketvibe
AI Sell-Off Triggers 10% Drop and Exposes Chipmaker Risks
Introduction
The recent sell-off in AI stocks has sent ripples through the market, particularly affecting chipmakers. This downturn has led to significant declines in the shares of companies like SK Hynix and Samsung, impacting broader indices such as South Korea's Kospi. Understanding the underlying market dynamics, including the role of MarketVibe's Crash Warning Index (CWI), can provide traders with valuable insights into managing risk and navigating these turbulent times.
Market Impact
The AI stock sell-off has been particularly harsh on chipmakers, with SK Hynix and Samsung experiencing notable declines. This has contributed to a more than 10% drop in South Korea's Kospi index. Such movements highlight the interconnectedness of global markets and the specific vulnerabilities of sectors heavily reliant on AI and semiconductor technologies.
Key Players
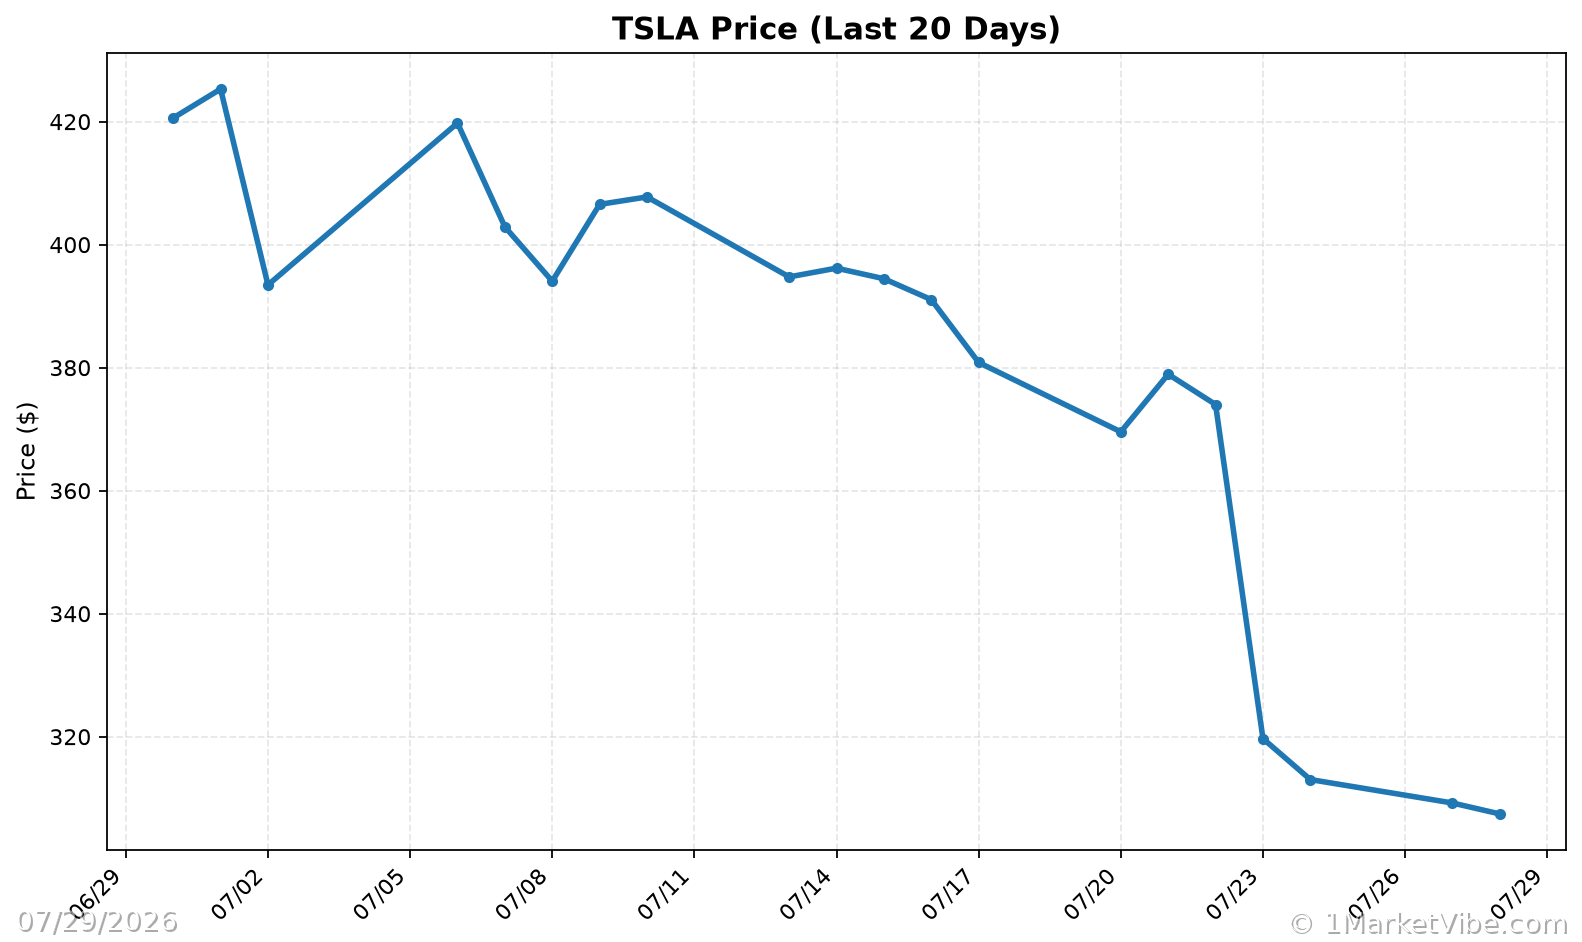
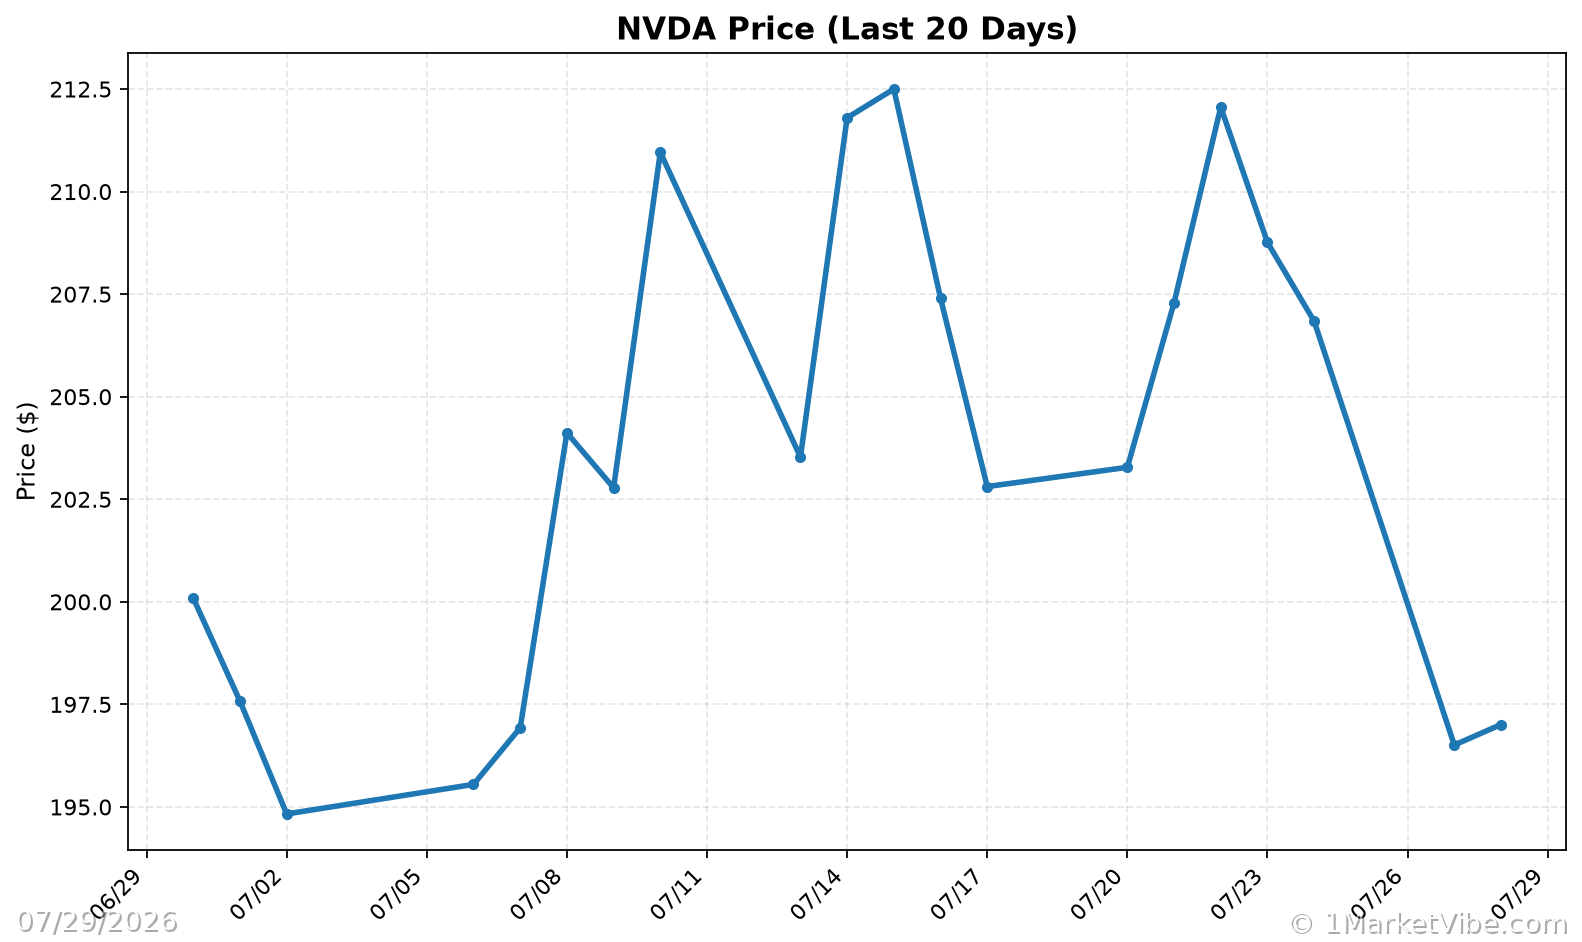
In addition to SK Hynix and Samsung, other major players like Nvidia, Micron, and Sandisk have also seen their stock prices tumble. This decline is not isolated to chipmakers; broader tech stocks, including SpaceX and Tesla, have been affected as well. These shifts underscore the importance of understanding sector-specific risks and the broader market context.
Investor Sentiment
Current market sentiment towards chipmakers is cautious, with investors wary of the potential for further declines. Factors contributing to the sell-off include concerns over supply chain disruptions, geopolitical tensions, and the broader economic environment. Monitoring these elements can help traders anticipate potential market movements.
Economic Context
The sell-off in chipmakers is occurring alongside significant economic developments, such as plunging oil prices due to U.S.-Iran peace hopes. These factors can influence market dynamics, as energy prices often have a ripple effect across various sectors, including technology.
CW Index Connection
The Crash Warning Index (CWI) is a valuable tool for understanding the current market environment. Currently reading at 4.32, the CWI suggests elevated risk levels, indicating that corrections are more likely. This index is a composite measure that considers breadth, volatility, and defensive behavior, providing traders with a comprehensive view of market risk.
How It Works – Mechanics & Data
The CWI is constructed by analyzing several dimensions of market risk, including:
- Breadth: Measures the percentage of stocks above their 50-day moving average, indicating trend health.
- Volatility: Assessed through metrics like ATR% (Average True Range as a percentage of price), which indicates market stability.
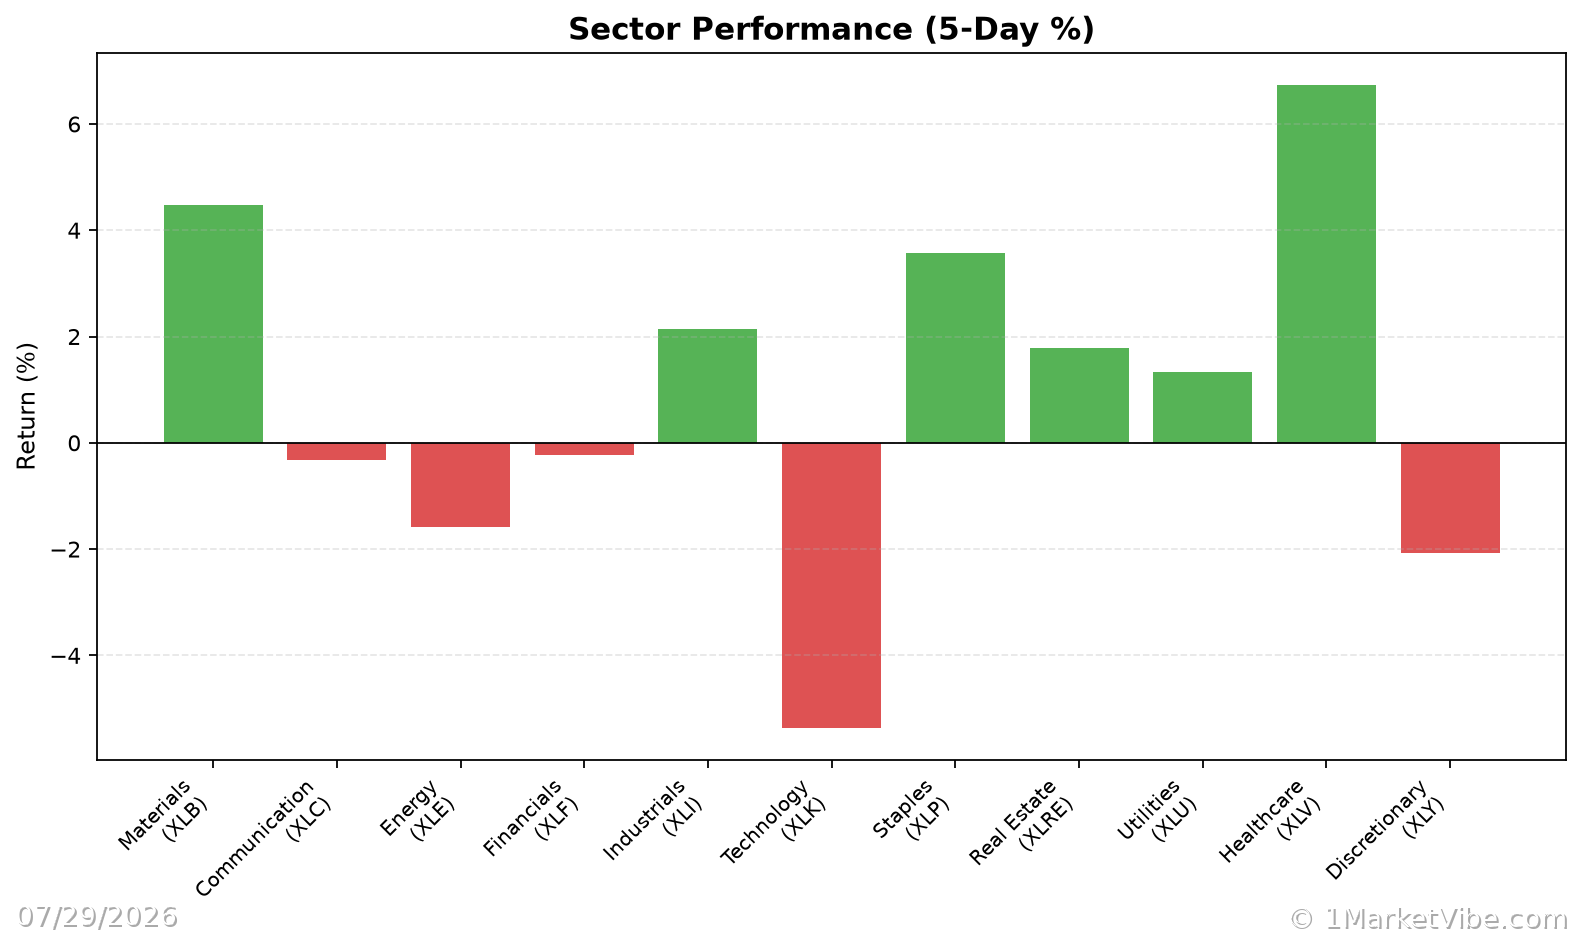
- Defensive Behavior: Observes the performance of defensive sectors relative to the broader market.
These components are combined to provide a single index value that reflects overall market risk. Day-to-day movements in the CWI are influenced by changes in these underlying factors, such as shifts in market breadth or spikes in volatility.
Interpretation – What Different Levels Tend to Mean
- CWI below 3: Generally indicates a stable market environment with lower risk.
- CWI between 3 and 6: Suggests caution, as risk levels are elevated and corrections are more likely.
- CWI above 6: Signals high risk, often preceding significant market downturns.
Common combinations include:
- Strong breadth + low volatility: Indicates a healthy, trending market.
- Weak breadth + rising volatility: Often precedes market corrections or downturns.
- Defensive sectors leading: Suggests a shift towards risk aversion.
Real-World Scenarios
Topping Environment: As the market grinds higher, breadth deteriorates, with fewer stocks above their 50-DMA. The CWI rises, indicating increased risk. Traders might be tempted to chase gains, but a more informed view would emphasize caution and risk management.
Bull Leg Surge: When the % Above 50-DMA surges and remains elevated, it signals a strong bull leg. Traders may feel confident adding exposure, but it's crucial to ensure setups align with broader market conditions.
Volatility Spike: A sudden jump in ATR% and an accelerating CWI can indicate a volatility spike. Traders might panic, but understanding these signals can help maintain a disciplined approach, focusing on risk management.
How to Use This Insight in a Process
- Emphasize Defense: When breadth is weak and CWI is high, prioritize defensive strategies and reduce new risk exposure.
- Add Exposure Cautiously: When breadth and leadership broaden, consider increasing exposure, but only if setups are favorable.
- Use the Market Dashboard: Leverage the Market Dashboard as a high-level regime label, confirming insights with internal metrics.
Common Misuses & Misconceptions
- Treating CWI as a Stand-Alone Signal: The CWI should be part of a broader analysis, not a sole decision-making tool.
- Ignoring Context: Consider sector rotation and time frame when interpreting metrics.
- Overreacting to One-Day Changes: Focus on trends and sustained movements rather than daily fluctuations.
To see these breadth and risk metrics in one place each day, you can use the Decision Edge dashboard at 1marketvibe.com.
Disclaimer: This article is for informational purposes only and does not constitute financial advice. Please consult a financial advisor for personalized guidance.
Charts