
AI Bubble Bursts: $2.4 Trillion Wiped Out
The recent downturn in the AI sector, resulting in a staggering $2.4 trillion loss, has sent ripples through the financial markets. This event highlights the inherent volatility of the AI sector and underscores the importance of understanding market dynamics. In this article, we'll explore how MarketVibe's metrics can help traders navigate such turbulent times, focusing on the Crash Warning Index (CWI) and other key indicators.
Understanding Market Volatility
Why Traders Should Care
Market volatility can significantly impact investment decisions. Understanding volatility helps traders manage risk, adjust their portfolios, and avoid emotional decision-making. Metrics like the CWI provide insights into market risk levels, helping traders anticipate potential downturns and adjust their strategies accordingly.
Mechanics of the Crash Warning Index (CWI)
The Crash Warning Index (CWI) is a composite metric that evaluates several risk dimensions, including market breadth, volatility, and defensive behavior. It aggregates data from various sources to provide a single, actionable risk score. For example, a CWI reading above 6 suggests elevated risk, indicating that traders should be cautious about taking on new positions.
The CWI moves based on changes in its underlying components:
- Breadth: Measures the proportion of stocks above their 50-day moving average (50-DMA). A decline in this metric indicates weakening market trends.
- Volatility: Assessed through metrics like ATR% (Average True Range as a percentage of price), which captures market choppiness.
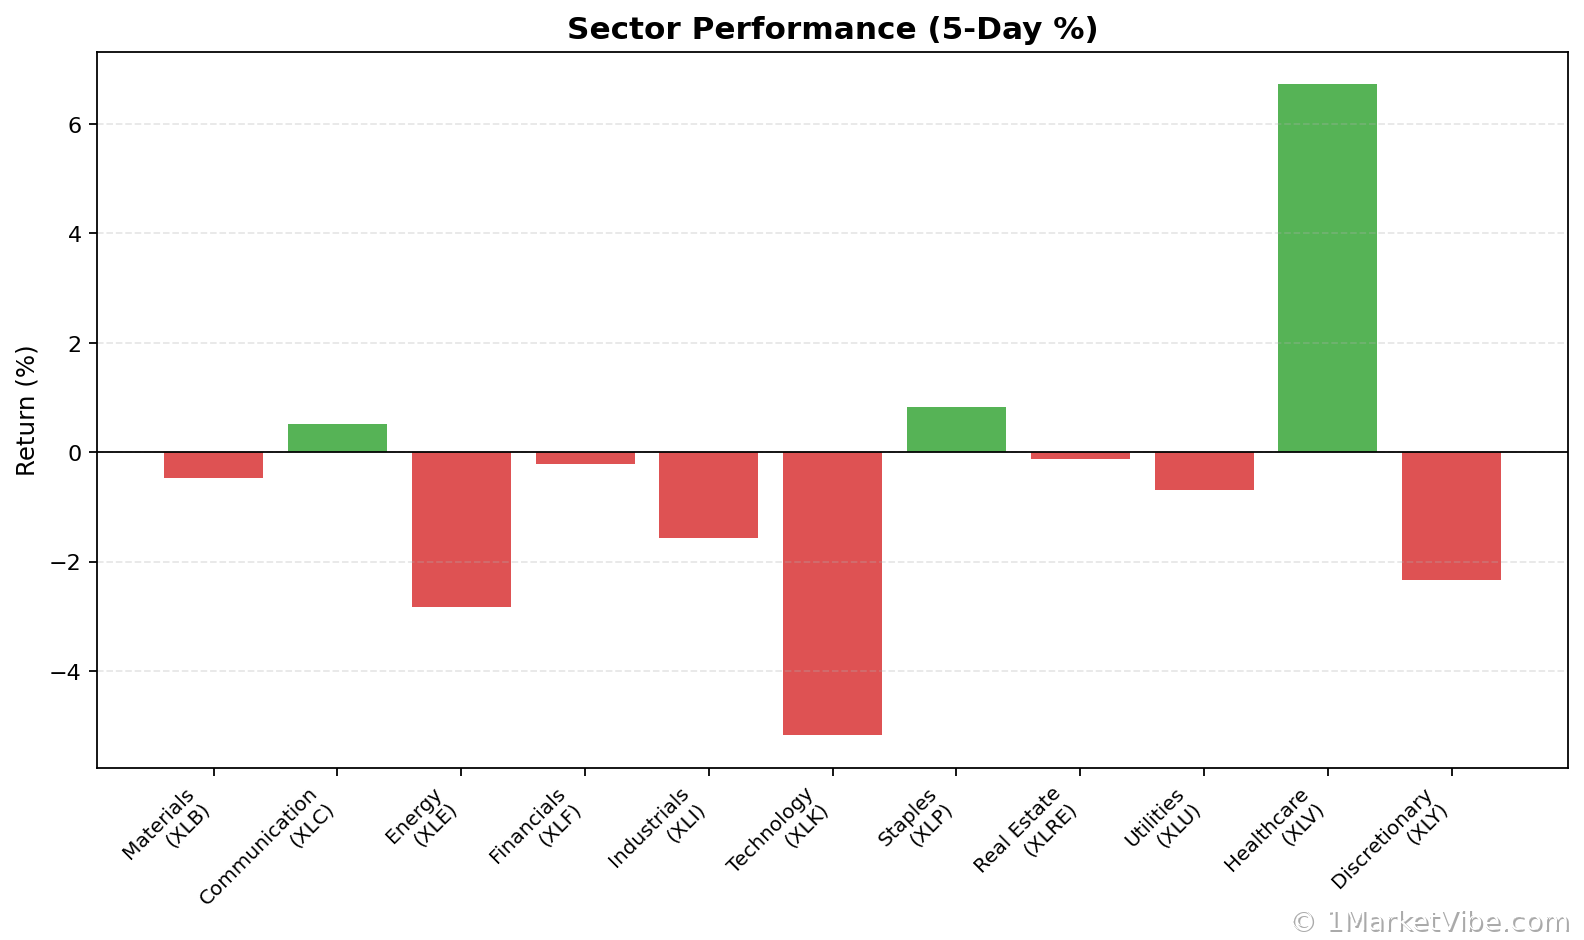
- Defensive Behavior: Observed through sector rotation into traditionally safer sectors like utilities or consumer staples.
Interpreting Market Signals
CWI Levels and Their Implications
- CWI below 3: Generally indicates a stable market environment with low risk. Traders can consider increasing exposure if other conditions are favorable.
- CWI between 3 and 6: Suggests moderate risk. Traders should be vigilant and possibly reduce exposure in volatile sectors.
- CWI above 6: Signals high risk. Emphasize defensive strategies and consider hedging existing positions.
Common Combinations
- Strong Breadth + Low Volatility: Typically seen in stable bull markets. Encourages risk-taking.
- Weak Breadth + Rising Volatility: Often precedes market corrections. Calls for caution and defensive positioning.
- Defensive Sectors Leading: Indicates a shift towards risk aversion, often seen when the CWI is high.
Real-World Scenarios
Scenario 1: Topping Environment
Imagine a scenario where major indices continue to climb, but the % Above 50-DMA declines steadily. This divergence often signals a topping environment. Traders might be tempted to chase the rally, but a high CWI would suggest caution, as underlying market health is deteriorating.
Scenario 2: Bull Market Surge
Consider a situation where the % Above 50-DMA surges and remains elevated, accompanied by low ATR%. This combination indicates a strong bull market leg. Traders should look for opportunities to add exposure, provided their setups align with the broader market trend.
Scenario 3: Volatility Spike
In a market where ATR% jumps significantly and the CWI accelerates, expect increased choppiness and potential corrections. Traders might feel pressured to exit positions hastily, but a more informed approach would involve reviewing sector leadership and adjusting exposure based on risk tolerance.
Incorporating Insights into a Trading Process
Practical Guidelines
- When Breadth is Weak and CWI is High: Focus on defense. Reduce new risk and consider protective strategies like options hedging.
- When Breadth and Leadership Broaden: Be open to increasing exposure, but ensure setups are robust and align with market conditions.
- Use the Market Dashboard: As a high-level regime label, then delve into internals for confirmation before making decisions.
Common Misuses and Misconceptions
- Treating CWI as a Stand-Alone Signal: The CWI should not be used in isolation. Always consider broader market context and other indicators.
- Ignoring Sector Rotation: Focusing solely on index levels can lead to missed opportunities. Pay attention to sector performance and leadership changes.
- Overreacting to One-Day Changes: Short-term volatility can skew perceptions. Focus on trends and sustained movements in metrics.
To see these breadth and risk metrics in one place each day, you can use the Decision Edge dashboard at 1marketvibe.com.
DISCLAIMER: This content is for informational purposes only and should not be considered as investment advice. Market conditions can change rapidly and unpredictably. MarketVibe authors, editors, and affiliates may hold positions in securities discussed in our analysis.